
Compare Shantai Indust. with Similar Stocks
Dashboard
With a Operating Losses, the company has a Weak Long Term Fundamental Strength
- Company's ability to service its debt is weak with a poor EBIT to Interest (avg) ratio of -0.24
- The company has been able to generate a Return on Equity (avg) of 1.10% signifying low profitability per unit of shareholders funds
- PAT(Q) At Rs -0.98 cr has Fallen at -1080.0%
- NET SALES(9M) At Rs 8.25 cr has Grown at -36.64%
- PBDIT(Q) Lowest at Rs -0.99 cr.
Risky - Negative EBITDA
Stock DNA
Industrial Manufacturing
INR 65 Cr (Micro Cap)
NA (Loss Making)
23
0.00%
-0.10
-10.72%
8.44
Total Returns (Price + Dividend) 
Latest dividend: 0.3300 per share ex-dividend date: Dec-08-2016
Risk Adjusted Returns v/s
Returns Beta

News
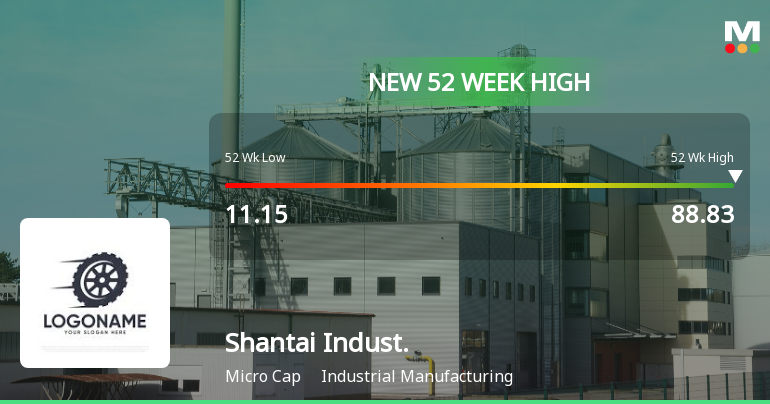
Broad-Based Technical Strength Lifts Shantai Industries Ltd to 52-Week High of Rs 88.83
With a remarkable 50.56% gain over the past 21 trading sessions, Shantai Industries Ltd surged to a fresh 52-week high of Rs 88.83 on 6 May 2026, showcasing a powerful momentum that has captivated market attention.
Read full news article
Broad-Based Technical Strength Lifts Shantai Industries Ltd to 52-Week High of Rs 87.09
From a low of Rs 11.15 to a fresh peak of Rs 87.09, Shantai Industries Ltd has surged an extraordinary 464.05% over the past year, defying the broader market’s 5.01% decline. This remarkable rally culminated in the stock hitting a new 52-week high today, fuelled by a confluence of strong technical signals and sustained price momentum.
Read full news article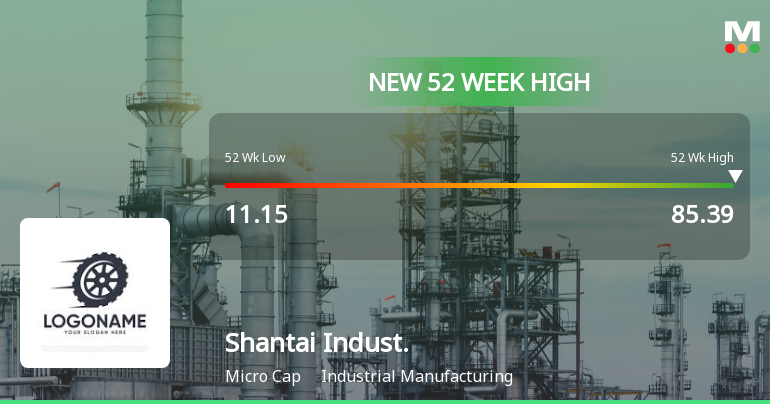
Broad-Based Technical Strength Lifts Shantai Industries Ltd to 52-Week High of Rs 85.39
Surging to a new 52-week high of Rs 85.39 on 4 May 2026, Shantai Industries Ltd has demonstrated remarkable price momentum, rallying over 50% in the past 21 trading sessions. This milestone caps a spectacular one-year return of 467.07%, vastly outperforming the Sensex’s decline of 3.6% over the same period.
Read full news article Announcements
Format of the Initial Disclosure to be made by an entity identified as a Large Corporate : Annexure A
20-Apr-2026 | Source : BSEFormat of Initial Disclosure to be made by an entity identified as a Large Corporate.
| Sr. No. | Particulars | Details |
| 1 | Name of Company | Shantai Industries Ltd |
| 2 | CIN NO. | L46411GJ1988PLC013255 |
| 3 | Outstanding borrowing of company as on 31st March / 31st December as applicable (in Rs cr) | 0.00 |
| 4 | Highest Credit Rating during the previous FY | NA |
| 4a | Name of the Credit Rating Agency issuing the Credit Rating mentioned in (4) | Not Applicable |
| 5 | Name of Stock Exchange# in which the fine shall be paid in case of shortfall in the required borrowing under the framework | BSE |
Designation: Company Secretary and Compliance officer
EmailId: csshantaiindustries@gmail.com
Designation: CFO
EmailId: shantaiindustriesltd@gmail.com
Date: 20/04/2026
Note: In terms para of 3.2(ii) of the circular beginning F.Y 2022 in the event of shortfall in the mandatory borrowing through debt securities a fine of 0.2% of the shortfall shall be levied by Stock Exchanges at the end of the two-year block period. Therefore an entity identified as LC shall provide in its initial disclosure for a financial year the name of Stock Exchange to which it would pay the fine in case of shortfall in the mandatory borrowing through debt markets.
Compliances-Certificate under Reg. 74 (5) of SEBI (DP) Regulations 2018
10-Apr-2026 | Source : BSEPlease find enclosed herewith certificate received from RTA under Reg. 74(5) of SEBI (DP) Regulations 2018
Closure of Trading Window
30-Mar-2026 | Source : BSEPlease find enclosed herewith the intimation of closure of trading window for the announcement of Audited Financial result for the quarter and year ended 31st March 2026
Corporate Actions

No Upcoming Board Meetings

Shantai Industries Ltd has declared 10% dividend, ex-date: 08 Dec 16

Shantai Industries Ltd has announced 2:10 stock split, ex-date: 09 May 25

Shantai Industries Ltd has announced 2:1 bonus issue, ex-date: 07 Jul 17

No Rights history available
Quality key factors
Valuation key factors
Technicals key factors
 Technical Indicator Scale: Bearish, Mildly Bearish, Sideways, Mildly Bullish, Bullish Turned
 Shareholding Snapshot : Mar 2026
Shareholding Compare (%holding)
Promoters
None
Held by 0 Schemes
Held by 0 FIIs
Vasudev Fatandas Sawlani (24.8%)
Prakashchand Sandh (3.98%)
22.53%
Quarterly Results Snapshot (Standalone) - Dec'25 - YoY

YoY Growth in quarter ended Dec 2025 is -81.63% vs 0.00% in Dec 2024
YoY Growth in quarter ended Dec 2025 is -1,080.00% vs 266.67% in Dec 2024
Half Yearly Results Snapshot (Standalone) - Sep'25

Growth in half year ended Sep 2025 is 40.42% vs 0.00% in Sep 2024
Growth in half year ended Sep 2025 is -41.67% vs 271.43% in Sep 2024
Nine Monthly Results Snapshot (Standalone) - Dec'25
YoY Growth in nine months ended Dec 2025 is -36.64% vs 0.00% in Dec 2024
YoY Growth in nine months ended Dec 2025 is -513.64% vs 269.23% in Dec 2024
Annual Results Snapshot (Standalone) - Mar'25
YoY Growth in year ended Mar 2025 is 1,469.77% vs 115.00% in Mar 2024
YoY Growth in year ended Mar 2025 is 616.67% vs 40.00% in Mar 2024
About Shantai Industries Ltd

Company Coordinates


