
Compare Som Distilleries with Similar Stocks
Dashboard
With a fall in Net Sales of -46.66%, the company declared Very Negative results in Mar 26
- The company has declared negative results for the last 3 consecutive quarters
- INTEREST(9M) At Rs 20.06 cr has Grown at 95.52%
- PAT(Q) At Rs -43.61 cr has Fallen at -291.9%
- ROCE(HY) Lowest at 6.01%
Despite the size of the company, domestic mutual funds hold only 0% of the company
Below par performance in long term as well as near term
Total Returns (Price + Dividend) 
Latest dividend: 0.09883047422680415 per share ex-dividend date: Dec-02-2022
Risk Adjusted Returns v/s
Returns Beta

News
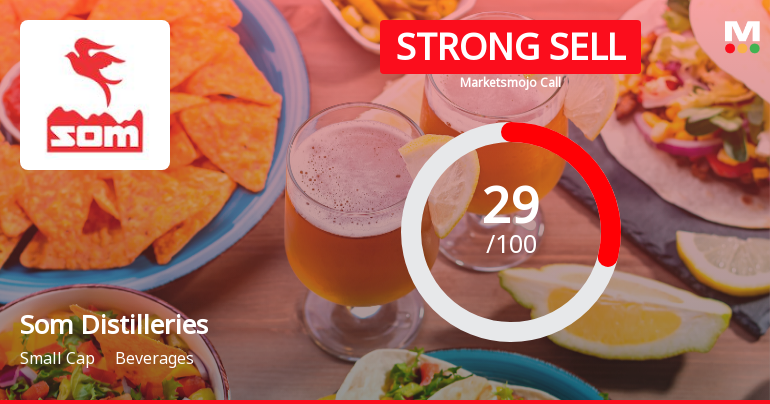
Som Distilleries & Breweries Downgraded to Strong Sell Amid Deteriorating Fundamentals and Bearish Technicals
Som Distilleries & Breweries Ltd has been downgraded from a Sell to a Strong Sell rating as of 23 June 2026, reflecting deteriorating fundamentals and worsening technical indicators. The company’s financial performance has shown significant weakness in recent quarters, while technical trends have shifted decisively bearish. This comprehensive analysis explores the four key parameters—Quality, Valuation, Financial Trend, and Technicals—that have driven this rating change.
Read full news article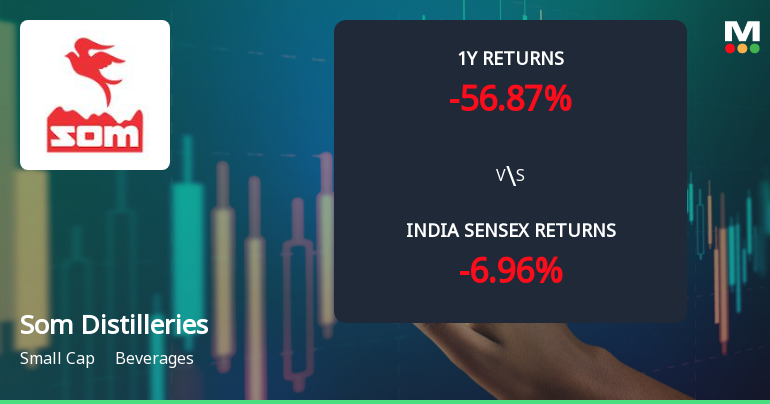
Som Distilleries & Breweries Ltd Faces Intensified Downtrend Amid Technical Deterioration
Som Distilleries & Breweries Ltd has experienced a marked shift in its technical momentum, with key indicators signalling a bearish trend. The stock’s recent performance, coupled with deteriorating technical parameters, has led to a downgrade in its Mojo Grade to Strong Sell, reflecting growing investor caution in this small-cap beverage company.
Read full news article
Announcements
Compliances-Certificate under Reg. 74 (5) of SEBI (DP) Regulations 2018
22-Jun-2026 | Source : BSECertificate Under Regulations 74(5) of SEBI ( Depositories and Participants) Regulations 2018 for the Month of May 2026
Update On License: - Action By The Excise Department Madhya Pradesh - Disclosure / Intimation Under Regulation 30 Of SEBI (LODR) Regulations 2015
19-Jun-2026 | Source : BSEUpdate on License:- Action by the Excise Department Madhya Pradesh - Disclosure/ Intimation under Regulation 30 of SEBI (LODR) Regulation 2025.
Announcement under Regulation 30 (LODR)-Press Release / Media Release
11-Jun-2026 | Source : BSEIntimation of Commencement of Commercial Production at the Brewery facility of our Wholly Owned Subsidiary -Woodpecker Green Agri Nutrients Private Limited
Corporate Actions

No Upcoming Board Meetings

Som Distilleries & Breweries Ltd has declared 5% dividend, ex-date: 02 Dec 22

Som Distilleries & Breweries Ltd has announced 2:5 stock split, ex-date: 24 May 24

No Bonus history available

Som Distilleries & Breweries Ltd has announced 10:211 rights issue, ex-date: 13 Apr 23
Quality key factors
Valuation key factors
Technicals key factors
 Technical Indicator Scale: Bearish, Mildly Bearish, Sideways, Mildly Bullish, Bullish Turned
 Shareholding Snapshot : Mar 2026
Shareholding Compare (%holding)
Non Institution
None
Held by 0 Schemes
Held by 18 FIIs (1.2%)
Jagdish Kumar Arora (23.71%)
Anil Kumar Arora (2.46%)
50.76%
Quarterly Results Snapshot (Consolidated) - Mar'26 - YoY

YoY Growth in quarter ended Mar 2026 is -46.66% vs -11.17% in Mar 2025
YoY Growth in quarter ended Mar 2026 is -344.08% vs 20.78% in Mar 2025
Half Yearly Results Snapshot (Consolidated) - Sep'25
Growth in half year ended Sep 2025 is -0.60% vs 26.88% in Sep 2024
Growth in half year ended Sep 2025 is 3.90% vs 22.11% in Sep 2024
Nine Monthly Results Snapshot (Consolidated) - Dec'25
YoY Growth in nine months ended Dec 2025 is -5.02% vs 22.79% in Dec 2024
YoY Growth in nine months ended Dec 2025 is -15.65% vs 17.95% in Dec 2024
Annual Results Snapshot (Consolidated) - Mar'26
YoY Growth in year ended Mar 2026 is -14.80% vs 12.67% in Mar 2025
YoY Growth in year ended Mar 2026 is -90.22% vs 12.46% in Mar 2025
About Som Distilleries & Breweries Ltd

Company Coordinates


