
Compare Aryaman Capital with Similar Stocks
Stock DNA
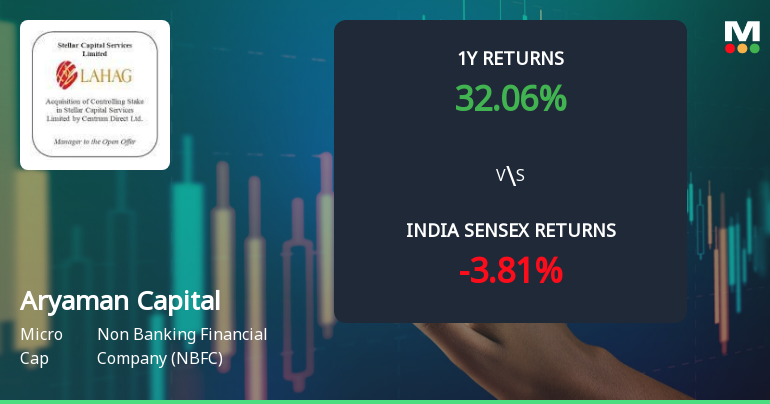
Non Banking Financial Company (NBFC)
INR 521 Cr (Micro Cap)
18.00
21
0.00%
0.00
25.71%
4.65
Total Returns (Price + Dividend) 
Aryaman Capital for the last several years.
Risk Adjusted Returns v/s
Returns Beta

News
Aryaman Capital Markets Ltd Sees Mixed Technical Signals Amid Mild Momentum Shift
Aryaman Capital Markets Ltd, a micro-cap player in the Non Banking Financial Company (NBFC) sector, has exhibited a notable shift in its technical momentum, reflecting a complex interplay of bullish and bearish signals. Despite a recent day gain of 4.99%, the company’s overall technical indicators present a nuanced picture, with some metrics improving while others remain subdued, prompting a reassessment of its market stance.
Read full news article
Aryaman Capital Markets Ltd is Rated Strong Sell
Aryaman Capital Markets Ltd is rated Strong Sell by MarketsMOJO. This rating was last updated on 12 February 2026. However, the analysis and financial metrics discussed here reflect the stock’s current position as of 24 July 2026, providing investors with the latest insights into the company’s performance and outlook.
Read full news article
Aryaman Capital Markets Ltd is Rated Strong Sell
Aryaman Capital Markets Ltd is rated Strong Sell by MarketsMOJO, with this rating last updated on 12 February 2026. However, the analysis and financial metrics discussed here reflect the stock's current position as of 13 July 2026, providing investors with the latest insights into the company’s performance and outlook.
Read full news article Announcements
Announcement under Regulation 30 (LODR)-Change in Management
31-Jul-2026 | Source : BSEIntimation under regulation 30 of SEBI (Listing Obligations and Disclosure Requirements) Regulations 2015- Appointment & Resignation of Independent Director and Reconstitution of Committee
Board Meeting Outcome for Outcome Of Board Meeting Held On July 31 2026
31-Jul-2026 | Source : BSEOutcome of Board Meeting Held on July 31 2026
Compliances-Certificate under Reg. 74 (5) of SEBI (DP) Regulations 2018
09-Jul-2026 | Source : BSECertificate under Regulation 74(5) of SEBI (DP) Regulations 2018 for the quarter ended June 30 2026
Corporate Actions

No Upcoming Board Meetings

No Dividend history available

No Splits history available

No Bonus history available

No Rights history available
Quality key factors
Valuation key factors
Technicals key factors
 Technical Indicator Scale: Bearish, Mildly Bearish, Sideways, Mildly Bullish, Bullish Turned
 Shareholding Snapshot : Jun 2026
Shareholding Compare (%holding)
Promoters
None
Held by 0 Schemes
Held by 0 FIIs
Aryaman Financial Services Limited (74.28%)
Stellar Capital Services Limited (3.84%)
7.98%
Quarterly Results Snapshot (Standalone) - Mar'26 - YoY
Not Applicable: The company has declared_date for only one period
Not Applicable: The company has declared_date for only one period
Half Yearly Results Snapshot (Standalone) - Sep'25

Growth in half year ended Sep 2025 is -28.10% vs 106.83% in Mar 2025
Growth in half year ended Sep 2025 is 4.41% vs 186.20% in Mar 2025
Nine Monthly Results Snapshot (Standalone) - Dec'25
YoY Growth in nine months ended Dec 2025 is 7.23% vs 78.25% in Dec 2024
YoY Growth in nine months ended Dec 2025 is 34.17% vs 147.88% in Dec 2024
Annual Results Snapshot (Standalone) - Mar'26
YoY Growth in year ended Mar 2026 is -20.79% vs 133.90% in Mar 2025
YoY Growth in year ended Mar 2026 is 21.19% vs 254.95% in Mar 2025
About Aryaman Capital Markets Ltd

Company Coordinates


