
Compare Hisar Spg. Mills with Similar Stocks
Stock DNA
Garments & Apparels
INR 17 Cr (Micro Cap)
5.00
23
0.00%
-0.01
13.82%
0.65
Total Returns (Price + Dividend) 
Hisar Spg. Mills for the last several years.
Risk Adjusted Returns v/s
Returns Beta

News
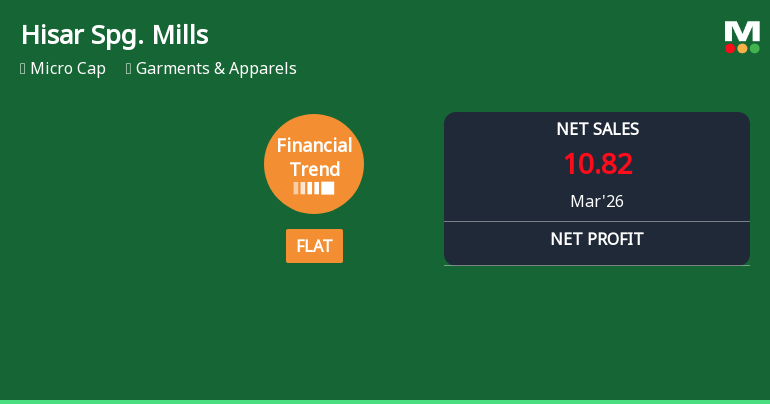
Hisar Spinning Mills Ltd Reports Flat Quarterly Performance Amid Shifting Financial Trends
Hisar Spinning Mills Ltd, a micro-cap player in the Garments & Apparels sector, has reported a flat financial performance for the quarter ended March 2026, marking a notable shift from its previously positive growth trajectory. The company’s financial trend score has declined sharply from 7 to 0 over the past three months, signalling a pause in momentum despite a recent uptick in its share price.
Read full news article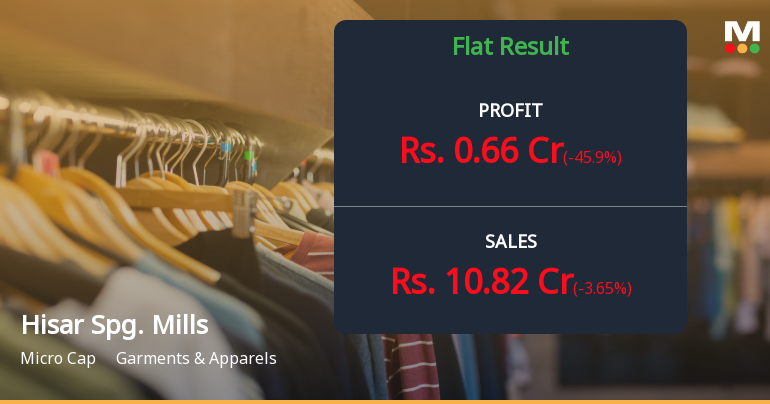
Hisar Spinning Mills Q4 FY26: Margin Compression Weighs on Profitability Despite Stable Revenue
Hisar Spinning Mills Ltd., a micro-cap cotton yarn manufacturer operating from Haryana, reported a challenging Q4 FY26 performance marked by significant margin compression despite maintaining relatively stable top-line growth. The company posted a net profit of ₹0.66 crores for the quarter ended March 2026, representing a substantial decline of 45.90% quarter-on-quarter from ₹1.22 crores in Q3 FY26, though showing a 36.52% decline year-on-year from ₹1.04 crores in Q4 FY25. With a modest market capitalisation of ₹17.00 crores and currently trading at ₹48.82, the stock gained 4.99% following the results announcement, though it remains 27.28% below its 52-week high of ₹67.13.
Read full news article Announcements
FINANCIAL RESULTS FOR THE QUARTER AND YEAR ENDED 31ST MARCH 2026
29-May-2026 | Source : BSEFINANCIAL RESULTS FOR THE QUARTER AND YEAR ENDED 31ST MARCH 2026.
FINANCIAL RESULTS FOR THE QUARTER AND YEAR ENDED 31ST MARCH 2026
29-May-2026 | Source : BSEFINANCIAL RESULTS FOR THE QUARTER AND YEAR ENDED 31ST MARCH 2026.
Compliances-Reg.24(A)-Annual Secretarial Compliance
21-May-2026 | Source : BSEAnnual Secretarial Compliance Report for the year ended March 31 2026
Corporate Actions

No Upcoming Board Meetings

No Dividend history available

No Splits history available

No Bonus history available

No Rights history available
Quality key factors
Valuation key factors
Technicals key factors
 Technical Indicator Scale: Bearish, Mildly Bearish, Sideways, Mildly Bullish, Bullish Turned
 Shareholding Snapshot : Mar 2026
Shareholding Compare (%holding)
Promoters
None
Held by 0 Schemes
Held by 0 FIIs
Sharad Goel (5.49%)
Mahendra Girdharilal Wadhwani (2.36%)
48.08%
Quarterly Results Snapshot (Standalone) - Mar'26 - QoQ

QoQ Growth in quarter ended Mar 2026 is -3.65% vs 1.26% in Dec 2025
QoQ Growth in quarter ended Mar 2026 is -45.90% vs 144.00% in Dec 2025
Half Yearly Results Snapshot (Standalone) - Sep'25
Growth in half year ended Sep 2025 is 0.05% vs 3.91% in Sep 2024

Growth in half year ended Sep 2025 is 37.86% vs 28.75% in Sep 2024
Nine Monthly Results Snapshot (Standalone) - Dec'25
YoY Growth in nine months ended Dec 2025 is -2.49% vs 7.90% in Dec 2024
YoY Growth in nine months ended Dec 2025 is 39.68% vs 43.18% in Dec 2024
Annual Results Snapshot (Standalone) - Mar'26
YoY Growth in year ended Mar 2026 is -1.72% vs 6.91% in Mar 2025
YoY Growth in year ended Mar 2026 is 12.97% vs 45.05% in Mar 2025
About Hisar Spinning Mills Ltd

Company Coordinates


