
Compare Venmax Drugs with Similar Stocks
Dashboard
Weak Long Term Fundamental Strength with an average Return on Equity (ROE) of 0.09%
- Poor long term growth as Operating profit has grown by an annual rate 10.45% of over the last 5 years
- Low ability to service debt as the company has a high Debt to EBITDA ratio of -0.05 times
Flat results in Mar 26
With ROE of 4.6, it has a Very Expensive valuation with a 4.5 Price to Book Value
Below par performance in long term as well as near term
Stock DNA
Pharmaceuticals & Biotechnology
INR 20 Cr (Micro Cap)
98.00
36
0.00%
-0.56
4.56%
4.56
Total Returns (Price + Dividend) 
Venmax Drugs for the last several years.
Risk Adjusted Returns v/s
Returns Beta

News
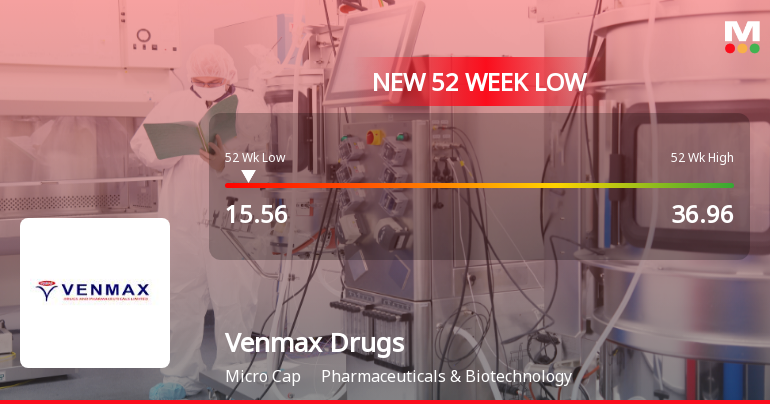
Venmax Drugs & Pharmaceuticals Ltd Falls to 52-Week Low of Rs 15.56 as Sell-Off Deepens
A sustained decline has pushed Venmax Drugs & Pharmaceuticals Ltd to a fresh 52-week low of Rs 15.56 on 16 Jul 2026, marking a 34.78% drop over the past year and signalling persistent pressure despite some recent outperformance relative to its sector.
Read full news article

Announcements
Compliances-Certificate under Reg. 74 (5) of SEBI (DP) Regulations 2018
14-Jul-2026 | Source : BSECertificate under Regulation 74(5) of the SEBI (Depositories and Participants) Regulations 2018 for the quarter ended June 30 2026.
Closure of Trading Window
27-Jun-2026 | Source : BSEIntimation of Closure of Trading Window pursuant to declaration of unaudited financial results for the quarter ended June 30 2026.
Announcement under Regulation 30 (LODR)-Newspaper Publication
15-May-2026 | Source : BSENewspaper Advertisement of the Audited Financial results for the Quarter and Year ended March 31 2026.
Corporate Actions

No Upcoming Board Meetings

No Dividend history available

No Splits history available

No Bonus history available

No Rights history available
Quality key factors
Valuation key factors
Technicals key factors
 Technical Indicator Scale: Bearish, Mildly Bearish, Sideways, Mildly Bullish, Bullish Turned
 Shareholding Snapshot : Jun 2026
Shareholding Compare (%holding)
Non Institution
None
Held by 0 Schemes
Held by 0 FIIs
Venkat Narender Nuka (8.0%)
Pushpa Bhaju (12.95%)
74.34%
Quarterly Results Snapshot (Standalone) - Mar'26 - QoQ

QoQ Growth in quarter ended Mar 2026 is 154.19% vs 17.42% in Dec 2025
QoQ Growth in quarter ended Mar 2026 is 266.67% vs 50.00% in Dec 2025
Half Yearly Results Snapshot (Standalone) - Sep'25
Not Applicable: The company has declared_date for only one period
Not Applicable: The company has declared_date for only one period
Nine Monthly Results Snapshot (Standalone) - Dec'25
Not Applicable: The company has declared_date for only one period
Not Applicable: The company has declared_date for only one period
Annual Results Snapshot (Standalone) - Mar'26
YoY Growth in year ended Mar 2026 is 890.12% vs 0.00% in Mar 2025
YoY Growth in year ended Mar 2026 is 2,600.00% vs -116.67% in Mar 2025
About Venmax Drugs & Pharmaceuticals Ltd

Company Coordinates


