
Compare Supreme Holdings with Similar Stocks
Dashboard
Poor Management Efficiency with a low ROE of 3.64%
- The company has been able to generate a Return on Equity (avg) of 3.64% signifying low profitability per unit of shareholders funds
Poor long term growth as Net Sales has grown by an annual rate of -39.04% and Operating profit at -225.47% over the last 5 years
Flat results in Mar 26
Risky - Negative EBITDA
Below par performance in long term as well as near term
Total Returns (Price + Dividend) 
Supreme Holdings for the last several years.
Risk Adjusted Returns v/s
Returns Beta

News

Supreme Holdings & Hospitality Ltd Downgraded to Strong Sell Amid Weak Fundamentals and Bearish Technicals
Supreme Holdings & Hospitality Ltd, a micro-cap player in the realty sector, has seen its investment rating downgraded from Sell to Strong Sell as of 2 July 2026. This shift reflects deteriorating technical indicators, poor financial trends, weak valuation metrics, and subpar quality scores, signalling heightened risk for investors amid ongoing market challenges.
Read full news article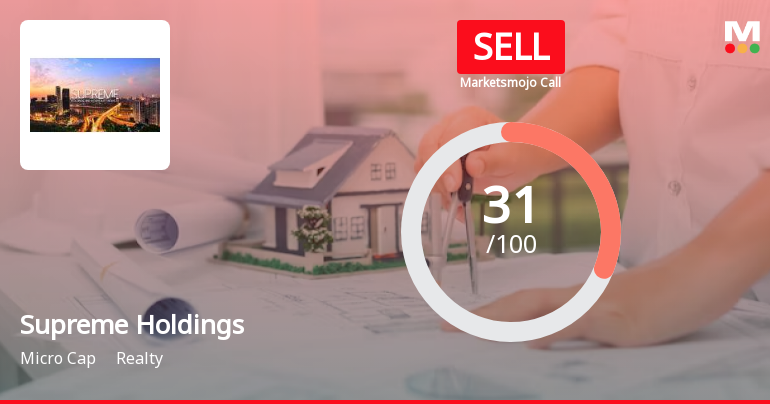
Supreme Holdings & Hospitality Ltd is Rated Sell
Supreme Holdings & Hospitality Ltd is rated 'Sell' by MarketsMOJO, with this rating last updated on 18 June 2026. However, the analysis and financial metrics presented here reflect the stock's current position as of 30 June 2026, providing investors with the latest insights into the company’s performance and outlook.
Read full news article
Supreme Holdings & Hospitality Ltd Upgraded to Sell on Technical Improvements Despite Weak Fundamentals
Supreme Holdings & Hospitality Ltd has seen its investment rating upgraded from Strong Sell to Sell, driven primarily by a shift in technical indicators despite persistent weaknesses in financial performance and valuation metrics. This nuanced change reflects a mild improvement in market sentiment, although fundamental challenges remain significant for investors to consider.
Read full news article Announcements
Closure of Trading Window
26-Jun-2026 | Source : BSEPursuant to SEBI (Prohibition of Insider Trading) Regulations 2015 and Companys Code of Conduct to regulate monitor and report trading by Designated Persons and Immediate Relatives of Designated Persons for prohibition of insider trading the Trading Window for dealing in securities of the Company for all the Designated Persons and Immediate Relatives of the Designated Persons shall remain closed from Wednesday July 01 2026 till 48 Hours (Forty-Eight) after announcement/declaration of Unaudited Financial Results for the Quarter Ended June 30 2026.
Audited Financial Results (Standalone And Consolidated) For The Financial Year Ended March 31 2026
15-May-2026 | Source : BSEPlease find enclosed herewith the Audited Financial Results (Standalone & Consolidated) for the Financial Year ended March 31 2026 along with Statutory Auditors Report thereon & declaration for unmodified opinion.
Compliances-Reg.24(A)-Annual Secretarial Compliance
15-May-2026 | Source : BSEPlease find enclosed herewith Annual Secretarial Compliance Report for the Financial Year Ended March 31 2026.
Corporate Actions

No Upcoming Board Meetings

No Dividend history available

No Splits history available

No Bonus history available

No Rights history available
Quality key factors
Valuation key factors
Technicals key factors
 Technical Indicator Scale: Bearish, Mildly Bearish, Sideways, Mildly Bullish, Bullish Turned
 Shareholding Snapshot : Mar 2026
Shareholding Compare (%holding)
Promoters
0.6672
Held by 0 Schemes
Held by 2 FIIs (0.39%)
Trinity Trust (21.87%)
Jumbo Bright Group Limited (23.3%)
13.23%
Quarterly Results Snapshot (Consolidated) - Mar'26 - YoY

YoY Growth in quarter ended Mar 2026 is 1,223.53% vs -99.15% in Mar 2025
YoY Growth in quarter ended Mar 2026 is 95.27% vs -206.96% in Mar 2025
Half Yearly Results Snapshot (Consolidated) - Sep'25

Growth in half year ended Sep 2025 is -99.44% vs 23.28% in Sep 2024
Growth in half year ended Sep 2025 is -95.68% vs 57.40% in Sep 2024
Nine Monthly Results Snapshot (Consolidated) - Dec'25
YoY Growth in nine months ended Dec 2025 is -97.64% vs 27.58% in Dec 2024
YoY Growth in nine months ended Dec 2025 is -96.06% vs 94.42% in Dec 2024
Annual Results Snapshot (Consolidated) - Mar'26
YoY Growth in year ended Mar 2026 is -94.25% vs -7.64% in Mar 2025
YoY Growth in year ended Mar 2026 is -96.29% vs 33.59% in Mar 2025
About Supreme Holdings & Hospitality Ltd

Company Coordinates


