
Compare MPS Pharmaa with Similar Stocks
Dashboard
With HIgh Debt (Debt-Equity Ratio at 6.9 times)- the company has a Weak Long Term Fundamental Strength
- Poor long term growth as Net Sales has grown by an annual rate of % and Operating profit at 0% over the last 5 years
- High Debt Company with a Debt to Equity ratio (avg) at 0 times
Flat results in Dec 25
Risky - Not traded in last 10 days
Stock DNA
Pharmaceuticals & Biotechnology
INR 3 Cr (Micro Cap)
NA (Loss Making)
21
0.00%
6.90
-83.28%
2.92
Total Returns (Price + Dividend) 
MPS Pharmaa for the last several years.
Risk Adjusted Returns v/s
Returns Beta

News
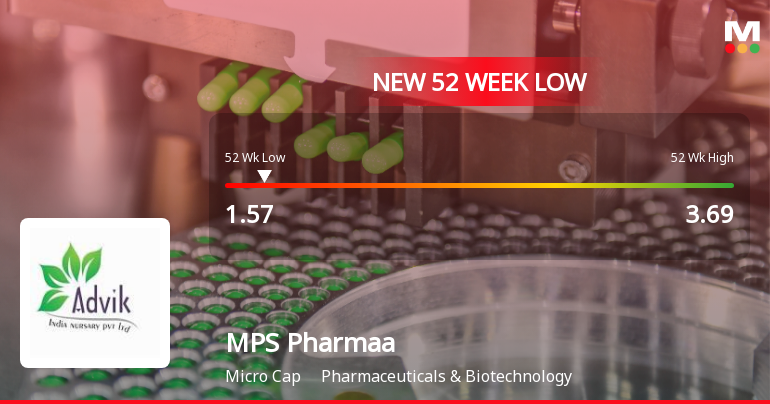
MPS Pharmaa Ltd Stock Hits 52-Week Low Amidst Weak Financial Metrics
MPS Pharmaa Ltd’s shares declined sharply to a new 52-week low of Rs.1.57 on 2 Mar 2026, reflecting ongoing pressures within the Pharmaceuticals & Biotechnology sector. The stock underperformed its sector peers and broader market indices, marking a significant milestone in its recent trading performance.
Read full news article Announcements
Closure of Trading Window
27-Mar-2026 | Source : BSEclosure of Trading Window Disclosure
Board Meeting Outcome for Outcome Of Independent Director
25-Mar-2026 | Source : BSEThis is to inform you that pursuant to Regulation 25(3) of the Securities and Exchange Board of India (LODR) Regulations 2015 read with Schedule IV of the Companies Act 2013 a separate meeting of the Independent Directors of the Company for the Financial Year 2025-26 was held today i.e. on Wednesday 25 th March 2026 at 11:00 A.M. at the corporate office of the company at 703 Arunachal Building 19 Barakhamba Road Connaught Place New Delhi-110001 wherein all the Independent Directors present at the meeting
Notice Of Separate Meeting Of Independent Directors Of The Company
16-Mar-2026 | Source : BSEPlease find enclosed Notice of Separate Meeting of Independent Directors of the Company
Corporate Actions

No Upcoming Board Meetings

No Dividend history available

No Splits history available

No Bonus history available

No Rights history available
Quality key factors
Valuation key factors
Technicals key factors
 Technical Indicator Scale: Bearish, Mildly Bearish, Sideways, Mildly Bullish, Bullish Turned
 Shareholding Snapshot : Sep 2025
Shareholding Compare (%holding)
Non Institution
16.0362
Held by 0 Schemes
Held by 0 FIIs
Omkam Pharmaceuticals Private Limited (25.65%)
Pataliputra International Limited (17.51%)
37.11%
Quarterly Results Snapshot (Standalone) - Dec'25 - QoQ
QoQ Growth in quarter ended Dec 2025 is 0.00% vs 0.00% in Sep 2025
QoQ Growth in quarter ended Dec 2025 is 0.00% vs 0.00% in Sep 2025
Half Yearly Results Snapshot (Standalone) - Sep'24
Not Applicable: The company has declared_date for only one period
Not Applicable: The company has declared_date for only one period
Nine Monthly Results Snapshot (Standalone) - Dec'24
YoY Growth in nine months ended Dec 2024 is 0.00% vs 0.00% in Jun 2024

YoY Growth in nine months ended Dec 2024 is 12.86% vs -42.86% in Jun 2024
Annual Results Snapshot (Standalone) - Mar'25
Not Applicable: The company has declared_date for only one period
Not Applicable: The company has declared_date for only one period
About MPS Pharmaa Ltd

Company Coordinates


