
Compare Stanpacks(India) with Similar Stocks
Dashboard
Weak Long Term Fundamental Strength with a -2.97% CAGR growth in Operating Profits over the last 5 years
- Low ability to service debt as the company has a high Debt to EBITDA ratio of 7.86 times
- The company has been able to generate a Return on Equity (avg) of 1.10% signifying low profitability per unit of shareholders funds
Negative results in Mar 26
Reducing Promoter Confidence
Underperformed the market in the last 1 year
Stock DNA
Packaging
INR 5 Cr (Micro Cap)
NA (Loss Making)
20
0.00%
1.18
-1.15%
0.83
Total Returns (Price + Dividend) 
Latest dividend: 0.5000 per share ex-dividend date: Sep-18-2006
Risk Adjusted Returns v/s
Returns Beta

News
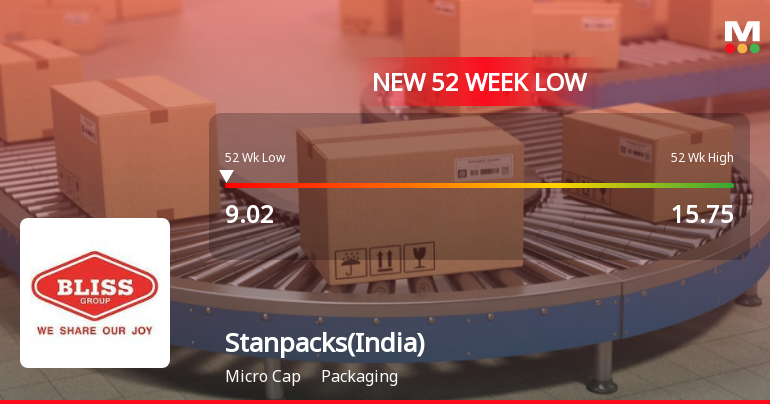
Stanpacks (India) Ltd Falls to 52-Week Low of Rs 9.02 as Sell-Off Deepens
A sharp decline in Stanpacks (India) Ltd has pushed the stock to a fresh 52-week low of Rs 9.02 on 8 Jul 2026, marking a 27.72% drop over the past year and signalling sustained selling pressure despite some stabilisation in broader market indices.
Read full news article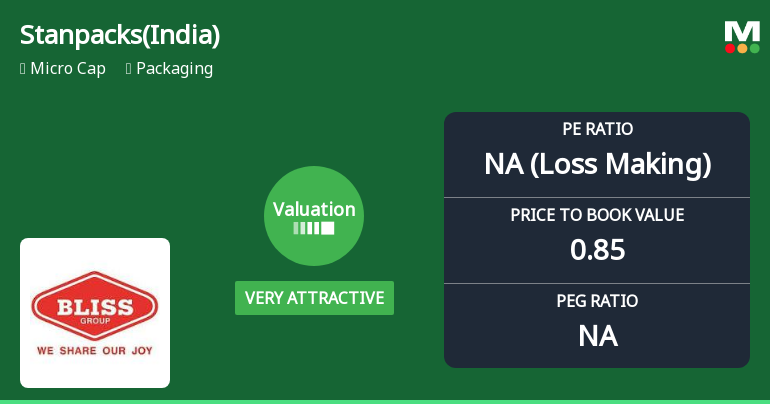
Stanpacks (India) Ltd Valuation Shifts to Very Attractive Amid Market Pressure
Stanpacks (India) Ltd, a micro-cap player in the packaging sector, has witnessed a significant shift in its valuation parameters, moving from an already attractive position to a very attractive one. Despite ongoing market headwinds and a recent downgrade in its overall mojo grade to Strong Sell, the company’s price-to-earnings (P/E) and price-to-book value (P/BV) ratios suggest a compelling valuation opportunity relative to its historical averages and peer group.
Read full news article
Stanpacks (India) Ltd Valuation Shifts to Very Attractive Amid Market Headwinds
Stanpacks (India) Ltd, a micro-cap player in the packaging sector, has seen a significant shift in its valuation parameters, moving from an attractive to a very attractive rating despite ongoing market headwinds and a deteriorating operational performance. This article analyses the recent valuation changes, compares them with peer averages and historical benchmarks, and assesses the implications for investors amid a challenging market environment.
Read full news article Announcements
Closure of Trading Window
27-Jun-2026 | Source : BSEQ1 2026 - 27 Closure of Trading Window
Board Meeting Outcome for Outcome For Board Meeting - Standalone Audited Financials Results Of The Company For The Quarter And Year Ended 31St March 2026
15-May-2026 | Source : BSEOutcome for Board Meeting - Standalone Audited Financials Results Of The Company For The Quarter And Year Ended 31St March 2026
Board Meeting Intimation for Approval Of Audited Financial Results For The Quarter And The Year Ended 31.03.2026.
08-May-2026 | Source : BSEStanpacks India Ltdhas informed BSE that the meeting of the Board of Directors of the Company is scheduled on 15/05/2026 inter alia to consider and approve Audited Financial results for the quarter and the year ended 31.03.2026.
Corporate Actions

No Upcoming Board Meetings

Stanpacks (India) Ltd has declared 5% dividend, ex-date: 18 Sep 06

No Splits history available

No Bonus history available

No Rights history available
Quality key factors
Valuation key factors
Technicals key factors
 Technical Indicator Scale: Bearish, Mildly Bearish, Sideways, Mildly Bullish, Bullish Turned
 Shareholding Snapshot : Mar 2026
Shareholding Compare (%holding)
Non Institution
None
Held by 1 Schemes (1.44%)
Held by 0 FIIs
Balaji Trading Enterprises Pvt Ltd (21.25%)
Muralidhar G (4.86%)
56.72%
Quarterly Results Snapshot (Standalone) - Mar'26 - QoQ

QoQ Growth in quarter ended Mar 2026 is 27.51% vs -26.60% in Dec 2025
QoQ Growth in quarter ended Mar 2026 is -116.67% vs -175.00% in Dec 2025
Half Yearly Results Snapshot (Standalone) - Sep'25
Growth in half year ended Sep 2025 is 8.24% vs -2.29% in Sep 2024

Growth in half year ended Sep 2025 is -15.38% vs 176.47% in Sep 2024
Nine Monthly Results Snapshot (Standalone) - Dec'25
YoY Growth in nine months ended Dec 2025 is 3.38% vs 2.81% in Dec 2024
YoY Growth in nine months ended Dec 2025 is -70.59% vs 151.52% in Dec 2024
Annual Results Snapshot (Standalone) - Mar'26
YoY Growth in year ended Mar 2026 is 3.35% vs 6.72% in Mar 2025
YoY Growth in year ended Mar 2026 is -175.00% vs -55.56% in Mar 2025
About Stanpacks (India) Ltd

Company Coordinates


