
Compare Lambodhara Text. with Similar Stocks
Stock DNA
Garments & Apparels
INR 124 Cr (Micro Cap)
11.00
26
0.43%
0.07
9.00%
0.99
Total Returns (Price + Dividend) 
Latest dividend: 0.5 per share ex-dividend date: Sep-15-2025
Risk Adjusted Returns v/s
Returns Beta

News

Lambodhara Textiles Ltd is Rated Sell
Lambodhara Textiles Ltd is rated 'Sell' by MarketsMOJO, with this rating last updated on 02 Dec 2025. However, the analysis and financial metrics discussed here reflect the stock's current position as of 27 June 2026, providing investors with an up-to-date view of the company’s performance and outlook.
Read full news article
Lambodhara Textiles Ltd is Rated Sell by MarketsMOJO
Lambodhara Textiles Ltd is rated Sell by MarketsMOJO, with this rating last updated on 02 Dec 2025. However, the analysis and financial metrics presented here reflect the stock's current position as of 16 June 2026, providing investors with an up-to-date view of the company’s fundamentals, valuation, financial trends, and technical outlook.
Read full news article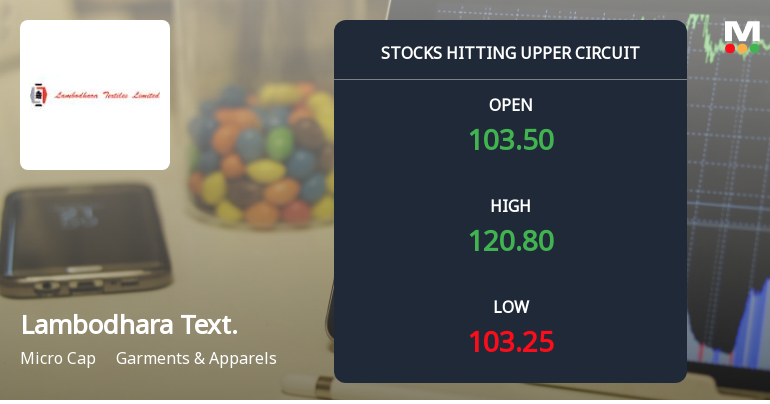
Lambodhara Textiles Ltd Locks at Upper Circuit With 13.2% Gain — Buyers Queue, Sellers Absent
At Rs 120.98, the buying was done — not because demand dried up, but because the exchange wouldn't let the stock go any higher. Lambodhara Textiles Ltd locked at its upper circuit of 13.2% on 1 Jun 2026, with buyers queuing and no sellers willing to part with shares.
Read full news article Announcements
Closure of Trading Window
25-Jun-2026 | Source : BSEPursuant to SEBI (Prohibition of Insider Trading) Regulation 2015 notice of Trading Window Closure is hereby given with effect from 1st July 2026 till 48 hours from the date of declaration of the unaudited financial results for the quarter ending on June 30 2026.
Announcement under Regulation 30 (LODR)-Newspaper Publication
01-Jun-2026 | Source : BSESubmission of Copies of newspaper publication regarding the audited financial results of the Company for the quarter and year ended 31st March 2026
Announcement under Regulation 30 (LODR)-Change in Directorate
30-May-2026 | Source : BSEThe Board of Directors has approved the re-appointment of Mr. Balu Narayanasamy Mrs. Bosco Giulia and Mr. Nishanth Balu as Whole-time Directors for a further period of 3 years subject to the approval of the members at the ensuing Annual General Meeting as per details attached
Corporate Actions

No Upcoming Board Meetings

Lambodhara Textiles Ltd has declared 10% dividend, ex-date: 15 Sep 25

Lambodhara Textiles Ltd has announced 5:10 stock split, ex-date: 15 Oct 15

No Bonus history available

No Rights history available
Quality key factors
Valuation key factors
Technicals key factors
 Technical Indicator Scale: Bearish, Mildly Bearish, Sideways, Mildly Bullish, Bullish Turned
 Shareholding Snapshot : Mar 2026
Shareholding Compare (%holding)
Promoters
39.2782
Held by 0 Schemes
Held by 1 FIIs (0.16%)
Strike Right Integrated Services Ltd (37.34%)
None
23.21%
Quarterly Results Snapshot (Standalone) - Mar'26 - QoQ

QoQ Growth in quarter ended Mar 2026 is -3.13% vs -5.53% in Dec 2025
QoQ Growth in quarter ended Mar 2026 is 30.42% vs -27.71% in Dec 2025
Half Yearly Results Snapshot (Standalone) - Sep'25

Growth in half year ended Sep 2025 is 4.43% vs 14.40% in Sep 2024
Growth in half year ended Sep 2025 is 7.47% vs 117.52% in Sep 2024
Nine Monthly Results Snapshot (Standalone) - Dec'25
YoY Growth in nine months ended Dec 2025 is 1.93% vs 16.20% in Dec 2024
YoY Growth in nine months ended Dec 2025 is 19.06% vs 107.86% in Dec 2024
Annual Results Snapshot (Standalone) - Mar'26
YoY Growth in year ended Mar 2026 is 2.72% vs 18.99% in Mar 2025
YoY Growth in year ended Mar 2026 is 61.29% vs 47.94% in Mar 2025
About Lambodhara Textiles Ltd

Company Coordinates


