
Compare BF Investment with Similar Stocks
Dashboard
Weak Long Term Fundamental Strength with an average Return on Equity (ROE) of 4.79%
With a growth in Net Sales of 270.33%, the company declared Outstanding results in Mar 26
With ROE of 3.3, it has a Attractive valuation with a 0.2 Price to Book Value
Despite the size of the company, domestic mutual funds hold only 0.02% of the company
Stock DNA
Holding Company
INR 1,710 Cr (Small Cap)
6.00
21
0.00%
0.00
3.30%
0.20
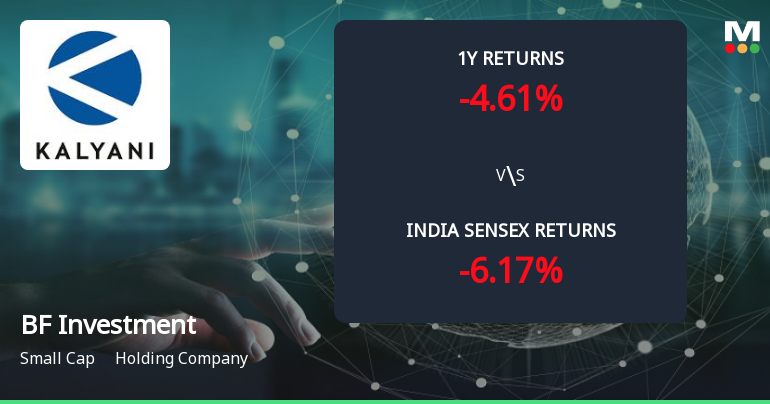
Total Returns (Price + Dividend) 
BF Investment for the last several years.
Risk Adjusted Returns v/s
Returns Beta

News
Golden Cross Forms in BF Investment Ltd Amid Mixed Technical Signals
The 50-day moving average has crossed above the 200-day moving average for BF Investment Ltd, signalling a golden cross on 24 Jun 2026. Yet, the broader technical landscape presents a nuanced picture, with monthly momentum indicators remaining bearish despite weekly signals turning positive. This divergence invites a closer examination of the signal's reliability in the context of recent price action and fundamentals.
Read full news article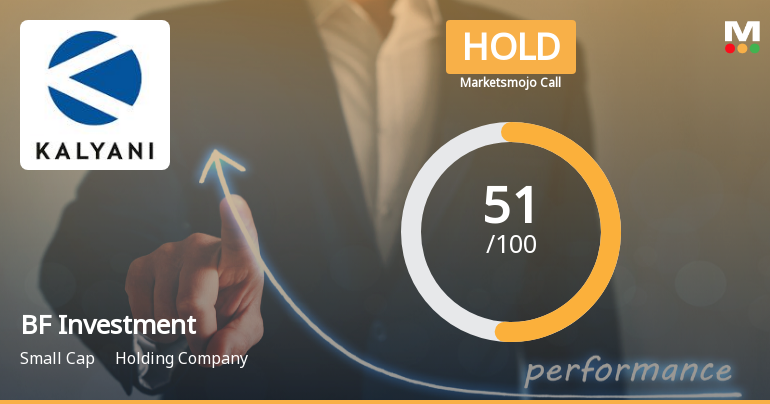
BF Investment Ltd Upgraded to Hold by MarketsMOJO on Improved Technicals and Valuation
BF Investment Ltd has seen its investment rating upgraded from Sell to Hold, reflecting a notable improvement in its technical indicators and financial performance. The upgrade, effective from 23 June 2026, is driven by a combination of stabilising technical trends, robust quarterly results, and attractive valuation metrics, signalling a cautious but positive outlook for this small-cap holding company.
Read full news article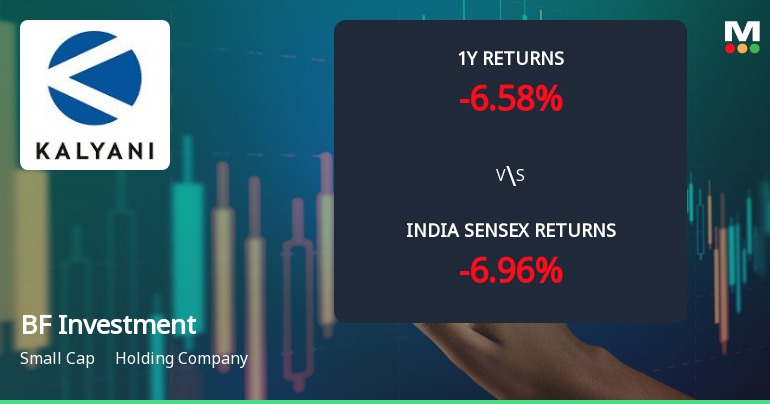
BF Investment Ltd Technical Momentum Shifts Amid Mixed Market Signals
BF Investment Ltd, a small-cap holding company, has experienced a notable shift in its technical momentum, moving from a mildly bearish stance to a sideways trend. Despite a recent day decline of 2.21%, the stock’s technical indicators present a complex picture with bullish signals on weekly charts contrasting with bearish monthly trends, prompting a cautious Hold rating upgrade from Sell by MarketsMOJO on 23 June 2026.
Read full news article Announcements
Closure of Trading Window
22-Jun-2026 | Source : BSEClosure of Trading window
Announcement under Regulation 30 (LODR)-Newspaper Publication
03-Jun-2026 | Source : BSENewspaper publication informing about reminder notice of another special window for re-lodgment of transfer requests of physical shares
Announcement under Regulation 30 (LODR)-Newspaper Publication
30-May-2026 | Source : BSENewspaper publication of Audited Financial Results for the year ended March 31 2026
Corporate Actions

No Upcoming Board Meetings

No Dividend history available

No Splits history available

No Bonus history available

No Rights history available
Quality key factors
Valuation key factors
Technicals key factors
 Technical Indicator Scale: Bearish, Mildly Bearish, Sideways, Mildly Bullish, Bullish Turned
 Shareholding Snapshot : Mar 2026
Shareholding Compare (%holding)
Promoters
None
Held by 6 Schemes (0.0%)
Held by 9 FIIs (0.66%)
Ajinkya Investment And Trading Company (34.1%)
Krutadnya Management And Trading Services Llp (4.16%)
15.11%
Quarterly Results Snapshot (Consolidated) - Mar'26 - QoQ

QoQ Growth in quarter ended Mar 2026 is 270.33% vs -47.75% in Dec 2025

QoQ Growth in quarter ended Mar 2026 is 27.81% vs 123.73% in Dec 2025
Half Yearly Results Snapshot (Consolidated) - Sep'25
Growth in half year ended Sep 2025 is 9.43% vs 28.61% in Sep 2024
Growth in half year ended Sep 2025 is -64.14% vs 74.10% in Sep 2024
Nine Monthly Results Snapshot (Consolidated) - Dec'25
YoY Growth in nine months ended Dec 2025 is 9.36% vs 20.54% in Dec 2024
YoY Growth in nine months ended Dec 2025 is -25.64% vs 22.95% in Dec 2024
Annual Results Snapshot (Consolidated) - Mar'26
YoY Growth in year ended Mar 2026 is 23.05% vs 46.19% in Mar 2025
YoY Growth in year ended Mar 2026 is 26.87% vs -48.75% in Mar 2025
About BF Investment Ltd

Company Coordinates


