
Compare Sportking India with Similar Stocks
Dashboard
Poor long term growth as Net Sales has grown by an annual rate of 13.83% and Operating profit at 3.70% over the last 5 years
Positive results in Mar 26
With ROCE of 12.1, it has a Fair valuation with a 1.7 Enterprise value to Capital Employed
Despite the size of the company, domestic mutual funds hold only 0% of the company
Market Beating performance in long term as well as near term
Stock DNA
Garments & Apparels
INR 2,313 Cr (Micro Cap)
19.00
26
0.54%
0.41
10.73%
2.11
Total Returns (Price + Dividend) 
Latest dividend: 1 per share ex-dividend date: Aug-22-2025
Risk Adjusted Returns v/s
Returns Beta

News

Sportking India Ltd is Rated Hold by MarketsMOJO
Sportking India Ltd is rated 'Hold' by MarketsMOJO, with this rating last updated on 22 May 2026. However, the analysis and financial metrics discussed here reflect the stock's current position as of 18 June 2026, providing investors with an up-to-date perspective on the company’s performance and outlook.
Read full news article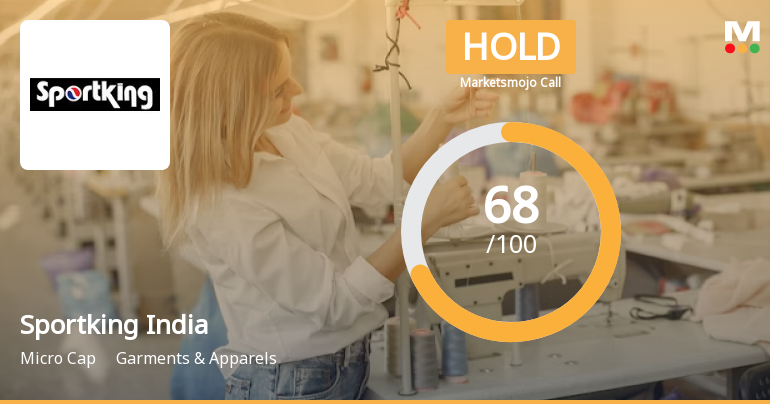
Sportking India Ltd is Rated Hold
Sportking India Ltd is rated 'Hold' by MarketsMOJO, with this rating last updated on 22 May 2026. However, the analysis and financial metrics presented here reflect the stock's current position as of 07 June 2026, providing investors with the most recent and relevant data to assess the company’s prospects.
Read full news article
Sportking India Ltd is Rated Hold by MarketsMOJO
Sportking India Ltd is rated 'Hold' by MarketsMOJO, with this rating last updated on 22 May 2026. However, the analysis and financial metrics discussed here reflect the stock's current position as of 08 June 2026, providing investors with an up-to-date view of the company’s performance and prospects.
Read full news article Announcements
Announcement under Regulation 30 (LODR)-Updates on Acquisition
18-Jun-2026 | Source : BSECommencement of Commercial Operation of Solar Power Project
Announcement under Regulation 30 (LODR)-Newspaper Publication
17-Jun-2026 | Source : BSESpecial Window for Transfer and Dematerialisation (Demat) of Physical Shares
Announcement under Regulation 30 (LODR)-Updates on Acquisition
03-Jun-2026 | Source : BSEUpdates of Disclosure under Regulation 30 of SEBI (Listing Obligations and Disclosure Requirements) Regulations 2015
Corporate Actions

No Upcoming Board Meetings

Sportking India Ltd has declared 100% dividend, ex-date: 22 Aug 25

Sportking India Ltd has announced 1:10 stock split, ex-date: 13 Sep 24

Sportking India Ltd has announced 3:1 bonus issue, ex-date: 23 Sep 21

No Rights history available
Quality key factors
Valuation key factors
Technicals key factors
 Technical Indicator Scale: Bearish, Mildly Bearish, Sideways, Mildly Bullish, Bullish Turned
 Shareholding Snapshot : Mar 2026
Shareholding Compare (%holding)
Promoters
None
Held by 0 Schemes
Held by 4 FIIs (0.24%)
Sobhagia Logistics Private Limited (24.03%)
Anil Kumar Goel (2.99%)
22.69%
Quarterly Results Snapshot (Standalone) - Mar'26 - QoQ

QoQ Growth in quarter ended Mar 2026 is -1.41% vs 2.95% in Dec 2025

QoQ Growth in quarter ended Mar 2026 is 33.17% vs -12.98% in Dec 2025
Half Yearly Results Snapshot (Standalone) - Sep'25
Growth in half year ended Sep 2025 is -5.64% vs 10.15% in Sep 2024
Growth in half year ended Sep 2025 is 5.14% vs 76.10% in Sep 2024
Nine Monthly Results Snapshot (Standalone) - Dec'25
YoY Growth in nine months ended Dec 2025 is -1.92% vs 7.33% in Dec 2024
YoY Growth in nine months ended Dec 2025 is 11.76% vs 63.88% in Dec 2024
Annual Results Snapshot (Standalone) - Mar'26
YoY Growth in year ended Mar 2026 is -1.12% vs 6.19% in Mar 2025
YoY Growth in year ended Mar 2026 is 5.81% vs 60.84% in Mar 2025
About Sportking India Ltd

Company Coordinates


