
Compare Golden Tobacco with Similar Stocks
Dashboard
Weak Long Term Fundamental Strength as the company has not declared results in the last 6 months
- Poor long term growth as Net Sales has grown by an annual rate of 16.87% and Operating profit at 0% over the last 5 years
- The company has a negative book value of Rs 205.26 crore
Negative results in Dec 21
Risky - No result in last 6 months
Consistent Underperformance against the benchmark over the last 3 years
Total Returns (Price + Dividend) 
Golden Tobacco for the last several years.
Risk Adjusted Returns v/s
Returns Beta

News

Golden Tobacco Ltd Locks at Lower Circuit With 4.83% Loss — Sellers Queue, No Buyers in Sight
At Rs 24.80, sellers were still queuing — but there were no buyers willing to take the other side. Golden Tobacco Ltd locked at its lower circuit of 4.83% on 15 Jun 2026, with unfilled sell orders and a frozen price, reflecting a constrained exit environment for shareholders.
Read full news article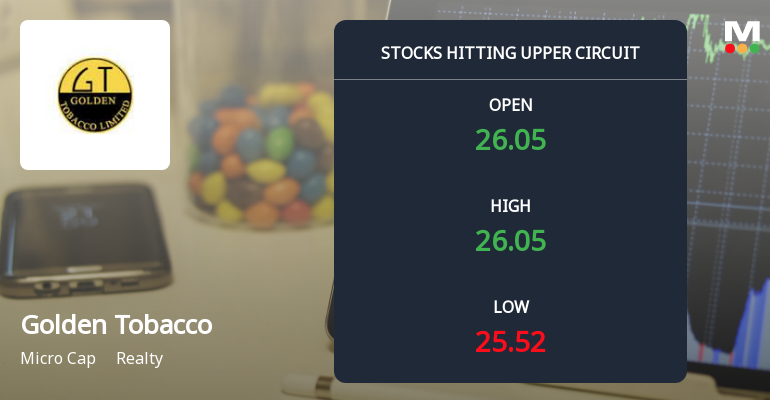
Golden Tobacco Ltd Locks at Upper Circuit With 4.95% Gain — Buyers Queue, Sellers Absent
At Rs 26.31, the buying was done — not because demand dried up, but because the exchange wouldn't let the stock go any higher. Golden Tobacco Ltd locked at its upper circuit of 4.95% on 8 Jun 2026, with buyers queuing and no sellers willing to part with shares.
Read full news article
Golden Tobacco Ltd is Rated Strong Sell
Golden Tobacco Ltd is rated Strong Sell by MarketsMOJO, with this rating last updated on 13 March 2024. However, the analysis and financial metrics presented here reflect the company’s current position as of 04 June 2026, providing investors with an up-to-date view of its fundamentals, returns, and market standing.
Read full news article Announcements
Compliances-Certificate under Reg. 74 (5) of SEBI (DP) Regulations 2018
10-Apr-2026 | Source : BSECompliance certificate under Regulation 74(5) for the quarter year ended 31st march 2026
Compliances-Certificate under Reg. 74 (5) of SEBI (DP) Regulations 2018
12-Jan-2026 | Source : BSEcompliance certificate for the quarter ended 31st December 2025.
Compliances-Certificate under Reg. 74 (5) of SEBI (DP) Regulations 2018
16-Oct-2025 | Source : BSECompliance under Reg. 74(5) of SEBI (DP) regulations2018
Corporate Actions

No Upcoming Board Meetings

No Dividend history available

No Splits history available

No Bonus history available

No Rights history available
Quality key factors
Valuation key factors
Technicals key factors
 Technical Indicator Scale: Bearish, Mildly Bearish, Sideways, Mildly Bullish, Bullish Turned
 Shareholding Snapshot : Mar 2026
Shareholding Compare (%holding)
Non Institution
None
Held by 2 Schemes (0.01%)
Held by 1 FIIs (0.02%)
Wgf Financial Services Ltd (5.45%)
J. P. Financial Services Pvt. Ltd. (22.15%)
31.38%
Quarterly Results Snapshot (Consolidated) - Dec'21 - QoQ

QoQ Growth in quarter ended Dec 2021 is 91.92% vs 120.00% in Sep 2021
QoQ Growth in quarter ended Dec 2021 is -190.12% vs 148.45% in Sep 2021
Half Yearly Results Snapshot (Consolidated) - Sep'21
Growth in half year ended Sep 2021 is -74.10% vs -24.29% in Sep 2020
Growth in half year ended Sep 2021 is 14.08% vs 83.51% in Sep 2020
Nine Monthly Results Snapshot (Consolidated) - Dec'21
YoY Growth in nine months ended Dec 2021 is -57.69% vs -9.14% in Dec 2020

YoY Growth in nine months ended Dec 2021 is -26.59% vs -359.22% in Dec 2020
Annual Results Snapshot (Consolidated) - Mar'21
YoY Growth in year ended Mar 2021 is 78.36% vs -69.20% in Mar 2020
YoY Growth in year ended Mar 2021 is 579.87% vs -105.83% in Mar 2020
About Golden Tobacco Ltd

Company Coordinates


