
Compare Heidelberg Cem. with Similar Stocks
Stock DNA
Cement & Cement Products
INR 3,526 Cr (Small Cap)
25.00
34
4.51%
-0.29
10.18%
2.56
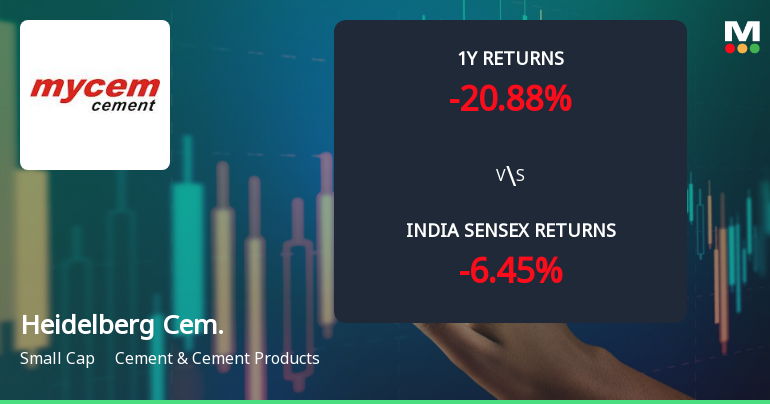
Total Returns (Price + Dividend) 
Latest dividend: 7 per share ex-dividend date: Sep-12-2025
Risk Adjusted Returns v/s
Returns Beta

News
HeidelbergCement India Ltd Technical Momentum Shifts Amid Mixed Market Signals
HeidelbergCement India Ltd has experienced a subtle shift in its technical momentum, moving from a bearish to a mildly bearish trend, reflecting a complex interplay of technical indicators. Despite a modest day gain of 1.51%, the stock’s broader technical signals present a nuanced picture that investors should carefully analyse amid a challenging market backdrop.
Read full news article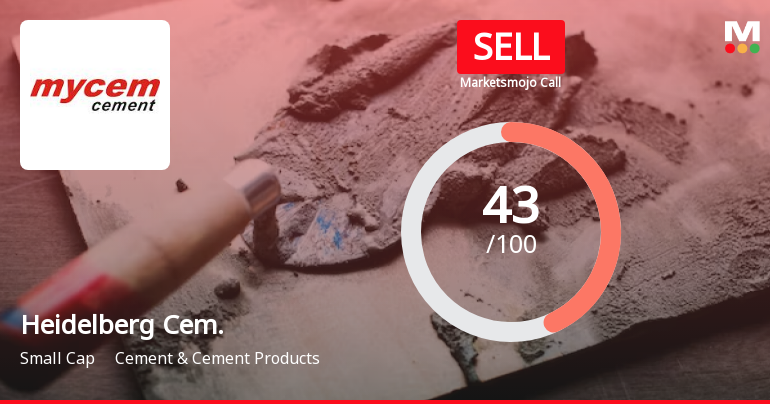
HeidelbergCement India Ltd is Rated Sell
HeidelbergCement India Ltd is rated Sell by MarketsMOJO. This rating was last updated on 29 September 2025. However, the analysis and financial metrics presented here reflect the stock’s current position as of 14 June 2026, providing investors with an up-to-date view of the company’s fundamentals, returns, and market performance.
Read full news article
HeidelbergCement India Ltd Faces Bearish Momentum Amid Technical Downgrade
HeidelbergCement India Ltd has experienced a notable shift in its technical momentum, with key indicators signalling a bearish trend. The company’s Mojo Grade was downgraded from Hold to Sell on 29 Sep 2025, reflecting deteriorating technical conditions amid a challenging market backdrop. This analysis delves into the recent price movements, technical indicator signals, and comparative performance against the broader Sensex index.
Read full news article Announcements
Announcement under Regulation 30 (LODR)-Earnings Call Transcript
03-Jun-2026 | Source : BSETranscript of Earnings Call.
Monthly Reporting Regarding Request For Re-Lodgement Of Transfer Request Of Physical Form
30-May-2026 | Source : BSEMonthly Reporting regarding request for re-lodgement of transfer request of physical form
Announcement under Regulation 30 (LODR)-Analyst / Investor Meet - Outcome
30-May-2026 | Source : BSELink of Audio Recording of Earnings Call - Regulation 30 of SEBI (Listing Obligations and Disclosure Requirements) Regulations 2015
Corporate Actions

No Upcoming Board Meetings

HeidelbergCement India Ltd has declared 70% dividend, ex-date: 12 Sep 25

No Splits history available

No Bonus history available

No Rights history available
Quality key factors
Valuation key factors
Technicals key factors
 Technical Indicator Scale: Bearish, Mildly Bearish, Sideways, Mildly Bullish, Bullish Turned
 Shareholding Snapshot : Mar 2026
Shareholding Compare (%holding)
Promoters
None
Held by 6 Schemes (10.58%)
Held by 48 FIIs (1.15%)
Heidelberg Materials South Asia B.v. (69.39%)
Sbi Elss Tax Saver Fund (4.72%)
11.38%
Quarterly Results Snapshot (Standalone) - Mar'26 - QoQ

QoQ Growth in quarter ended Mar 2026 is 12.55% vs 12.22% in Dec 2025
QoQ Growth in quarter ended Mar 2026 is 189.81% vs -37.42% in Dec 2025
Half Yearly Results Snapshot (Standalone) - Sep'25
Growth in half year ended Sep 2025 is 11.63% vs -14.50% in Sep 2024
Growth in half year ended Sep 2025 is 43.14% vs -42.00% in Sep 2024
Nine Monthly Results Snapshot (Standalone) - Dec'25
YoY Growth in nine months ended Dec 2025 is 9.56% vs -13.16% in Dec 2024
YoY Growth in nine months ended Dec 2025 is 57.66% vs -52.92% in Dec 2024
Annual Results Snapshot (Standalone) - Mar'26
YoY Growth in year ended Mar 2026 is 8.41% vs -9.17% in Mar 2025
YoY Growth in year ended Mar 2026 is 25.50% vs -36.36% in Mar 2025
About HeidelbergCement India Ltd

Company Coordinates


