
Compare Fermenta Biotec. with Similar Stocks
Dashboard
Weak Long Term Fundamental Strength with an average Return on Capital Employed (ROCE) of 8.88%
- Poor long term growth as Net Sales has grown by an annual rate of 6.85% and Operating profit at 4.95% over the last 5 years
With a fall in Net Sales of -13.06%, the company declared Very Negative results in Mar 26
Despite the size of the company, domestic mutual funds hold only 0% of the company
Stock DNA
Pharmaceuticals & Biotechnology
INR 1,001 Cr (Micro Cap)
15.00
34
0.74%
0.18
16.45%
2.46
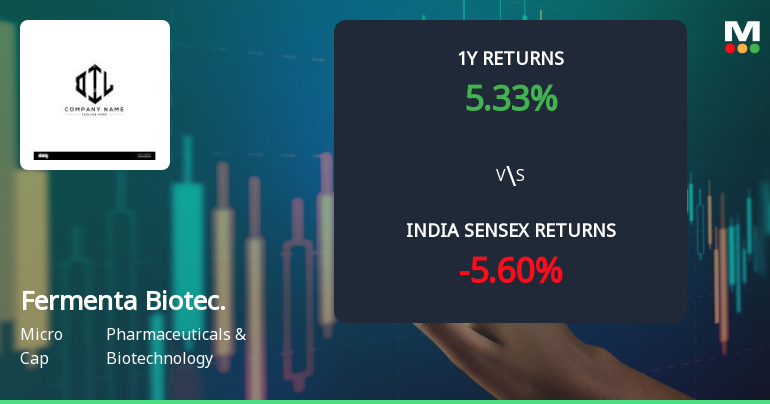
Total Returns (Price + Dividend) 
Latest dividend: 2.5 per share ex-dividend date: Aug-06-2025
Risk Adjusted Returns v/s
Returns Beta

News
Fermenta Biotech Ltd Sees Mixed Technical Signals Amid Sideways Momentum Shift
Fermenta Biotech Ltd has experienced a notable shift in its technical momentum, moving from a mildly bearish trend to a sideways pattern, reflecting a complex interplay of bullish and bearish signals across key indicators. Despite a robust day change of 6.20%, the stock’s technical landscape remains nuanced, with mixed signals from MACD, RSI, moving averages, and other momentum oscillators.
Read full news article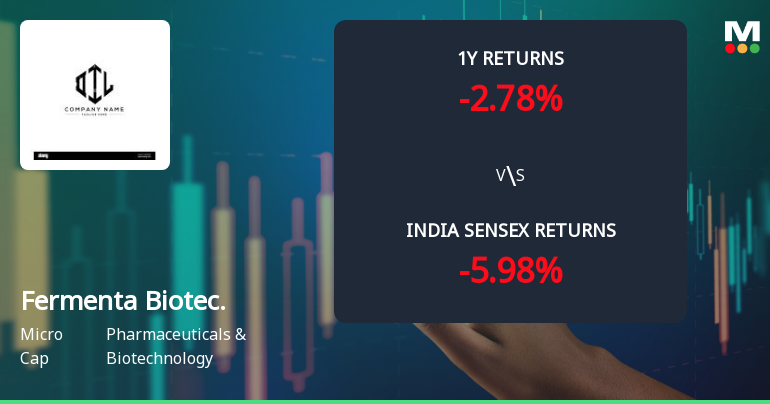
Fermenta Biotech Ltd Technical Analysis Reveals Mixed Momentum Amid Bearish Signals
Fermenta Biotech Ltd, a micro-cap player in the Pharmaceuticals & Biotechnology sector, has experienced a notable shift in its technical momentum, moving from a sideways trend to a mildly bearish stance. Despite some bullish signals on longer-term indicators, the stock’s recent price action and technical parameters suggest caution for investors as mixed signals emerge across key metrics.
Read full news article
Fermenta Biotech Ltd Technical Momentum Shifts Amid Mixed Market Signals
Fermenta Biotech Ltd has exhibited a notable shift in its technical momentum, moving from a mildly bearish stance to a sideways trend, reflecting a complex interplay of bullish and bearish signals across key indicators. Despite a 3.12% gain on the day to close at ₹338.80, the stock’s overall technical profile remains mixed, with divergent signals from MACD, RSI, moving averages, and volume-based indicators.
Read full news article Announcements
Announcement under Regulation 30 (LODR)-Analyst / Investor Meet - Intimation
17-Jun-2026 | Source : BSEIntimation of investor meeting to be held on June 22 2026.
Application To National Stock Exchange Of India Limited For Seeking Approval For Listing And Trading Of The CompanyS Equity Shares.
16-Jun-2026 | Source : BSEApplication to National Stock Exchange of India Limited for seeking approval for listing and trading of the Companys equity shares.
Announcement under Regulation 30 (LODR)-Newspaper Publication
15-Jun-2026 | Source : BSENewspaper publication regarding Saksham Niveshak campaign.
Corporate Actions

No Upcoming Board Meetings

Fermenta Biotech Ltd has declared 50% dividend, ex-date: 06 Aug 25

Fermenta Biotech Ltd has announced 5:5 stock split, ex-date: 08 Aug 18

Fermenta Biotech Ltd has announced 2:1 bonus issue, ex-date: 13 Feb 20

No Rights history available
Quality key factors
Valuation key factors
Technicals key factors
 Technical Indicator Scale: Bearish, Mildly Bearish, Sideways, Mildly Bullish, Bullish Turned
 Shareholding Snapshot : Mar 2026
Shareholding Compare (%holding)
Promoters
None
Held by 2 Schemes (0.0%)
Held by 2 FIIs (0.02%)
Krishna Datla (36.04%)
Rakesh Kantilal Shah (1.84%)
28.8%
Quarterly Results Snapshot (Consolidated) - Mar'26 - YoY

YoY Growth in quarter ended Mar 2026 is -13.06% vs 43.67% in Mar 2025
YoY Growth in quarter ended Mar 2026 is -44.20% vs 595.53% in Mar 2025
Half Yearly Results Snapshot (Consolidated) - Sep'25

Growth in half year ended Sep 2025 is 53.90% vs 24.25% in Sep 2024
Growth in half year ended Sep 2025 is 632.19% vs 121.41% in Sep 2024
Nine Monthly Results Snapshot (Consolidated) - Dec'25
YoY Growth in nine months ended Dec 2025 is 22.52% vs 38.31% in Dec 2024
YoY Growth in nine months ended Dec 2025 is 25.71% vs 363.46% in Dec 2024
Annual Results Snapshot (Consolidated) - Mar'26
YoY Growth in year ended Mar 2026 is 11.92% vs 39.87% in Mar 2025
YoY Growth in year ended Mar 2026 is -6.62% vs 433.30% in Mar 2025
About Fermenta Biotech Ltd

Company Coordinates


