
Compare Sh. Steel Wire with Similar Stocks
Dashboard
With a Operating Losses, the company has a Weak Long Term Fundamental Strength
- Company's ability to service its debt is weak with a poor EBIT to Interest (avg) ratio of -0.07
- The company has been able to generate a Return on Equity (avg) of 2.21% signifying low profitability per unit of shareholders funds
Flat results in Mar 26
Risky - Negative EBITDA
Consistent Underperformance against the benchmark over the last 3 years
Stock DNA
Iron & Steel Products
INR 9 Cr (Micro Cap)
NA (Loss Making)
26
0.00%
-0.24
-4.74%
0.70
Total Returns (Price + Dividend) 
Sh. Steel Wire for the last several years.
Risk Adjusted Returns v/s
Returns Beta

News
When is the next results date for Shree Steel Wire Ropes Ltd?
The next results date for Shree Steel Wire Ropes Ltd is scheduled for July 13, 2026....
Read full news articleAre Shree Steel Wire Ropes Ltd latest results good or bad?
Shree Steel Wire Ropes Ltd has reported its financial results for Q4 FY26, which present a complex picture of the company's operational performance. The company achieved a net profit of ₹0.04 crores, marking a return to profitability after several quarters of losses. This represents a significant turnaround from the previous quarter's loss. However, the revenue for the quarter was ₹1.80 crores, which, despite showing a sequential growth of 63.64% from the prior quarter, reflects a decline of 40.20% compared to the same period last year. The operating margin remains a concern, recorded at -1.11%, indicating ongoing challenges in covering operational costs. This is an improvement from the previous quarter's -10.91%, but it still signifies that the company is struggling to achieve sustainable profitability at an operational level. The return on equity (ROE) stands at 2.21%, suggesting limited efficiency in c...
Read full news article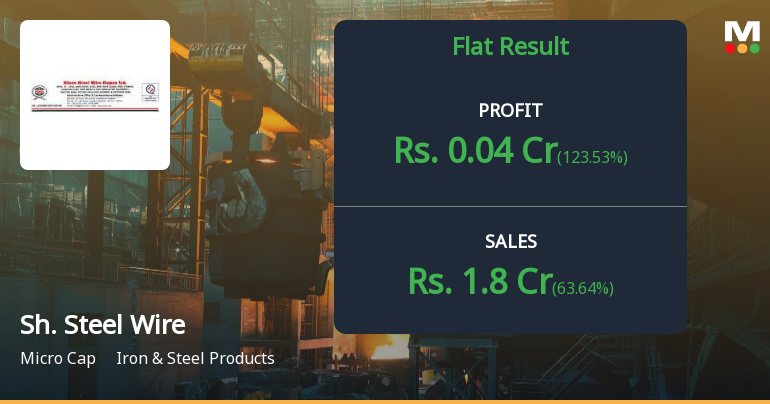
Shree Steel Wire Ropes Q4 FY26: Return to Profitability Masks Deeper Operational Struggles
Shree Steel Wire Ropes Ltd., a micro-cap steel wire rope manufacturer with a market capitalisation of ₹7.00 crores, reported a marginal profit of ₹0.04 crores in Q4 FY26 (March 2026 quarter), marking a return to the black after three consecutive quarters of losses. However, this modest turnaround barely conceals the company's fundamental operational challenges, as revenue declined 40.20% year-on-year to ₹1.80 crores whilst operating margins remained deeply negative at -1.11%.
Read full news article Announcements
Compliances-Certificate under Reg. 74 (5) of SEBI (DP) Regulations 2018
09-Jul-2026 | Source : BSECertificate from the RTA for the quarter ended 30.06.2026
Compliances-Certificate under Reg. 74 (5) of SEBI (DP) Regulations 2018
09-Jul-2026 | Source : BSECertificate from the RTA for the quarter ended 30.06.2026
Board Meeting Intimation for QUARTERLY RESULT FOR THE PERIOD ENDED 30.06.2026
02-Jul-2026 | Source : BSEShree Steel Wire Ropes Ltdhas informed BSE that the meeting of the Board of Directors of the Company is scheduled on 13/07/2026 inter alia to consider and approve Financial result for the period ended 30.06.2026 or any other matter with the consent of the Board.
Corporate Actions

(13 Jul 2026)

No Dividend history available

No Splits history available

No Bonus history available

No Rights history available
Quality key factors
Valuation key factors
Technicals key factors
 Technical Indicator Scale: Bearish, Mildly Bearish, Sideways, Mildly Bullish, Bullish Turned
 Shareholding Snapshot : Mar 2026
Shareholding Compare (%holding)
Non Institution
None
Held by 0 Schemes
Held by 0 FIIs
Bholenath Developers Private Limited (14.81%)
Dilip Bharat Manghnani (21.14%)
65.61%
Quarterly Results Snapshot (Standalone) - Mar'26 - QoQ

QoQ Growth in quarter ended Mar 2026 is 63.64% vs 25.00% in Dec 2025
QoQ Growth in quarter ended Mar 2026 is 123.53% vs 41.38% in Dec 2025
Half Yearly Results Snapshot (Standalone) - Sep'25

Growth in half year ended Sep 2025 is -63.80% vs 18.40% in Sep 2024
Growth in half year ended Sep 2025 is 0.00% vs 100.00% in Sep 2024
Nine Monthly Results Snapshot (Standalone) - Dec'25
YoY Growth in nine months ended Dec 2025 is -62.94% vs 24.77% in Dec 2024
YoY Growth in nine months ended Dec 2025 is -2,100.00% vs 85.71% in Dec 2024
Annual Results Snapshot (Standalone) - Mar'26
YoY Growth in year ended Mar 2026 is -56.89% vs 13.65% in Mar 2025
YoY Growth in year ended Mar 2026 is -148.00% vs -66.67% in Mar 2025
About Shree Steel Wire Ropes Ltd

Company Coordinates


