
Compare C J Gelatine with Similar Stocks
Dashboard
With HIgh Debt (Debt-Equity Ratio at 5.01 times)- the company has a Weak Long Term Fundamental Strength
- Poor long term growth as Operating profit has grown by an annual rate -10.47% of over the last 5 years
- High Debt Company with a Debt to Equity ratio (avg) of 2.37 times
- The company has been able to generate a Return on Equity (avg) of 7.51% signifying low profitability per unit of shareholders funds
Positive results in Mar 26
With ROCE of 4.1, it has a Fair valuation with a 1.3 Enterprise value to Capital Employed
Majority shareholders : Promoters
Market Beating Performance
Stock DNA
Specialty Chemicals
INR 12 Cr (Micro Cap)
64.00
45
0.00%
5.01
4.31%
2.78
Total Returns (Price + Dividend) 
C J Gelatine for the last several years.
Risk Adjusted Returns v/s
Returns Beta

News
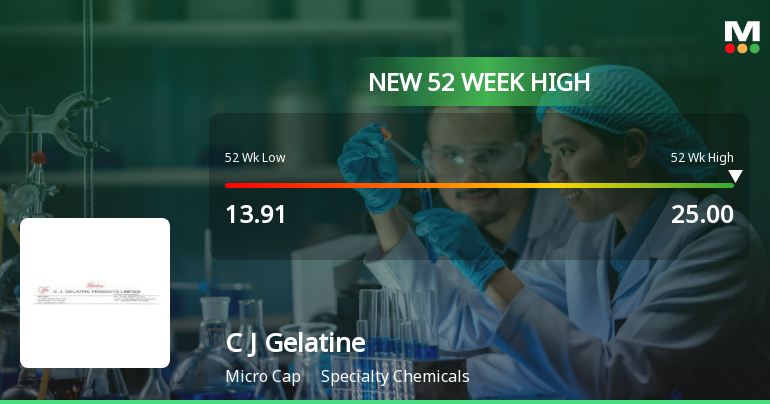
Broad-Based Technical Strength Lifts C J Gelatine Products Ltd to 52-Week High of Rs 25
With a sustained nine-day rally delivering a 38.5% gain, C J Gelatine Products Ltd surged to a fresh 52-week high of Rs 25 on 3 Jul 2026, outpacing its specialty chemicals sector peers and the broader market.
Read full news article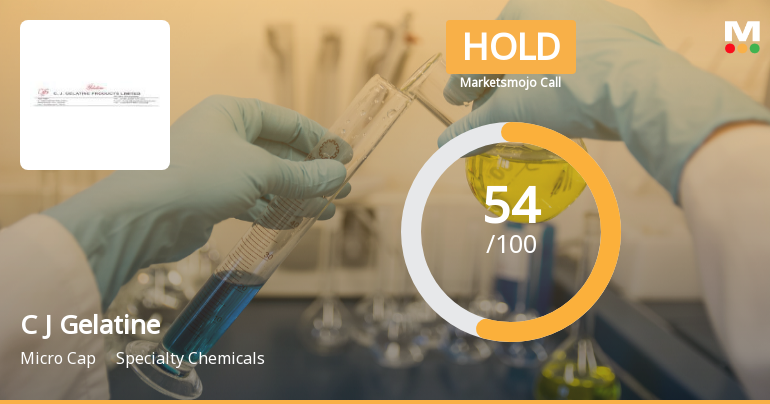
C J Gelatine Products Ltd Upgraded to Hold on Improved Technicals and Financial Performance
C J Gelatine Products Ltd, a micro-cap player in the Specialty Chemicals sector, has seen its investment rating upgraded from Sell to Hold as of 24 June 2026. This change reflects a combination of improved technical indicators, positive quarterly financial results, and a fair valuation relative to peers, despite some lingering concerns over long-term fundamentals and high debt levels.
Read full news article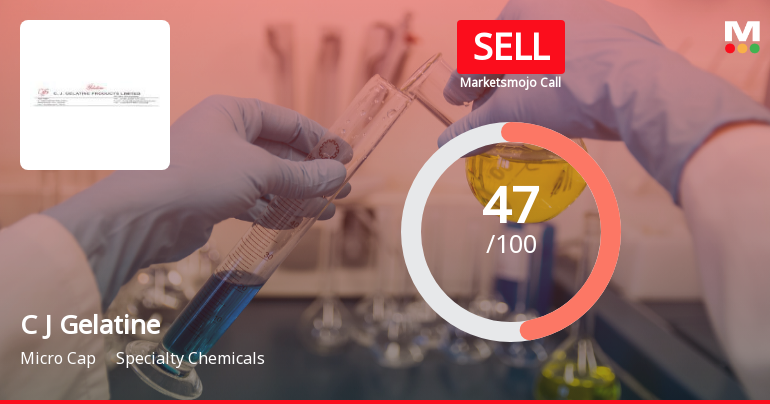
C J Gelatine Products Ltd Downgraded to Sell Amid Mixed Financial and Technical Signals
C J Gelatine Products Ltd, a micro-cap player in the Specialty Chemicals sector, has seen its investment rating downgraded from Hold to Sell as of 19 June 2026. This shift reflects a complex interplay of deteriorating technical indicators, subdued financial trends, and valuation concerns despite some recent operational improvements. The company’s Mojo Score now stands at 47.0, signalling caution for investors amid a challenging market backdrop.
Read full news article Announcements
Closure of Trading Window
27-Jun-2026 | Source : BSEThe Trading Window for dealing in securities of the Company for all insiders designated person and thier immediate dependent relatives connected person fiduciaries and intermediaries shall remain closed from July 1 2026 till the expiry of 48 (Forty Eight) hours after the declaration of the Financial Results of the Company for quarter ended June 30 2026.
Announcement under Regulation 30 (LODR)-Newspaper Publication
02-Jun-2026 | Source : BSEAttached is the extract of newspaper wherein financial results of the Company for the period ended March 31 2026 has been published.
Appointment Of Internal Auditors
30-May-2026 | Source : BSEDisclosure for appointment of internal auditors of the Company for Finanical Year 2026-2027
Corporate Actions

No Upcoming Board Meetings

No Dividend history available

No Splits history available

No Bonus history available

No Rights history available
Quality key factors
Valuation key factors
Technicals key factors
 Technical Indicator Scale: Bearish, Mildly Bearish, Sideways, Mildly Bullish, Bullish Turned
 Shareholding Snapshot : Mar 2026
Shareholding Compare (%holding)
Promoters
None
Held by 0 Schemes
Held by 0 FIIs
Jaspal Singh (57.49%)
Krishan Kumar Amla (4.01%)
35.69%
Quarterly Results Snapshot (Standalone) - Mar'26 - QoQ

QoQ Growth in quarter ended Mar 2026 is 11.37% vs -15.63% in Dec 2025

QoQ Growth in quarter ended Mar 2026 is 54.55% vs 175.00% in Dec 2025
Half Yearly Results Snapshot (Standalone) - Sep'25
Growth in half year ended Sep 2025 is 8.11% vs -5.67% in Sep 2024
Growth in half year ended Sep 2025 is 50.00% vs 86.11% in Sep 2024
Nine Monthly Results Snapshot (Standalone) - Dec'25
YoY Growth in nine months ended Dec 2025 is 2.71% vs 0.88% in Dec 2024
YoY Growth in nine months ended Dec 2025 is 133.33% vs 98.27% in Dec 2024
Annual Results Snapshot (Standalone) - Mar'26
YoY Growth in year ended Mar 2026 is 1.96% vs 0.98% in Mar 2025
YoY Growth in year ended Mar 2026 is 162.50% vs 104.10% in Mar 2025
About C J Gelatine Products Ltd

Company Coordinates


