
Compare Suryavanshi Spg. with Similar Stocks
Dashboard
With a Negative Book Value, the company has a Weak Long Term Fundamental Strength
- Poor long term growth as Net Sales has grown by an annual rate of -32.31% and Operating profit at 17.20% over the last 5 years
- High Debt Company with a Debt to Equity ratio (avg) at 0 times
Flat results in Dec 25
Risky - Negative Book Value
Below par performance in long term as well as near term
Stock DNA
Garments & Apparels
INR 9 Cr (Micro Cap)
6.00
20
0.00%
-1.68
-16.15%
-0.86
Total Returns (Price + Dividend) 
Latest dividend: 1.4600 per share ex-dividend date: Jul-30-2007
Risk Adjusted Returns v/s
Returns Beta

News
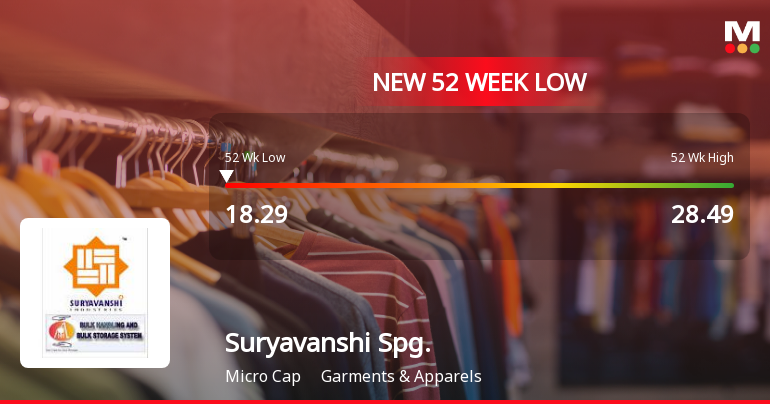
Suryavanshi Spinning Mills Ltd Falls to 52-Week Low of Rs 16.55 as Sell-Off Deepens
A sharp decline has pushed Suryavanshi Spinning Mills Ltd to a fresh 52-week low of Rs 16.55 on 6 Apr 2026, marking a significant 41.9% drop from its 52-week high of Rs 28.49. This downturn comes amid a broader market retreat, but the stock's underperformance far exceeds that of the Sensex, which itself is nearing a 52-week low.
Read full news article
Suryavanshi Spinning Mills Ltd Falls to 52-Week Low of Rs 17.42 as Sell-Off Deepens
A sharp decline has pushed Suryavanshi Spinning Mills Ltd to a fresh 52-week low of Rs 17.42 on 30 Mar 2026, marking a significant 38.9% drop from its 52-week high of Rs 28.49. This fall comes amid broader market weakness but is notably more severe than sector and benchmark indices, signalling stock-specific pressures.
Read full news article
Announcements
Compliances-Certificate under Reg. 74 (5) of SEBI (DP) Regulations 2018
07-Apr-2026 | Source : BSECertificate under Reg. 74(5) of SEBI (DP) Regulations 2018.
Closure of Trading Window
30-Mar-2026 | Source : BSEClosure of Trading Window.
Financial Results For The Quarter Ended 31.12.2025.
29-Jan-2026 | Source : BSEFinancial Results for the Quarter ended 31.12.2025.
Corporate Actions

No Upcoming Board Meetings

Suryavanshi Spinning Mills Ltd has declared 10% dividend, ex-date: 30 Jul 07

No Splits history available

No Bonus history available

No Rights history available
Quality key factors
Valuation key factors
Technicals key factors
 Technical Indicator Scale: Bearish, Mildly Bearish, Sideways, Mildly Bullish, Bullish Turned
 Shareholding Snapshot : Dec 2025
Shareholding Compare (%holding)
Promoters
None
Held by 4 Schemes (0.01%)
Held by 0 FIIs
Rajender Kumar Agarwal (42.36%)
Westend Developers Limited (4.9%)
28.55%
Quarterly Results Snapshot (Standalone) - Dec'25 - QoQ

QoQ Growth in quarter ended Dec 2025 is 81.02% vs 21.24% in Sep 2025
QoQ Growth in quarter ended Dec 2025 is 394.44% vs -600.00% in Sep 2025
Half Yearly Results Snapshot (Standalone) - Sep'25
Growth in half year ended Sep 2025 is 1,310.53% vs -99.13% in Sep 2024
Growth in half year ended Sep 2025 is 81.00% vs -2,426.67% in Sep 2024
Nine Monthly Results Snapshot (Standalone) - Dec'25
YoY Growth in nine months ended Dec 2025 is 1,100.00% vs -98.06% in Dec 2024
YoY Growth in nine months ended Dec 2025 is 138.14% vs -318.18% in Dec 2024
Annual Results Snapshot (Standalone) - Mar'25
YoY Growth in year ended Mar 2025 is 68.18% vs -98.76% in Mar 2024

YoY Growth in year ended Mar 2025 is -215.86% vs 704.17% in Mar 2024
About Suryavanshi Spinning Mills Ltd

Company Coordinates


