
Key Events This Week
13 Jul: New 52-week high (Rs.724.55)
14 Jul: Downgrade to Hold amid valuation concerns
14 Jul: Valuation shifts from attractive to fair
17 Jul: Week closes at Rs.661.65 (-3.88%)
Jul 17, 03:30 PM
BSE+NSE Vol: 559
Auto Components & Equipments
INR 251 Cr (Micro Cap)
22.00
48
1.96%
-0.04
5.12%
1.15
Latest dividend: 13.5 per share ex-dividend date: Jul-14-2026

13 Jul: New 52-week high (Rs.724.55)
14 Jul: Downgrade to Hold amid valuation concerns
14 Jul: Valuation shifts from attractive to fair
17 Jul: Week closes at Rs.661.65 (-3.88%)

Bimetal Bearings Ltd, a micro-cap player in the Auto Components & Equipments sector, has seen its investment rating downgraded from Buy to Hold as of 13 July 2026. The revision primarily stems from a reassessment of the company’s valuation metrics, despite continued positive financial trends and solid quality indicators. This article analyses the four key parameters—Quality, Valuation, Financial Trend, and Technicals—that influenced the change in rating and what it means for investors going forward.
Read full news article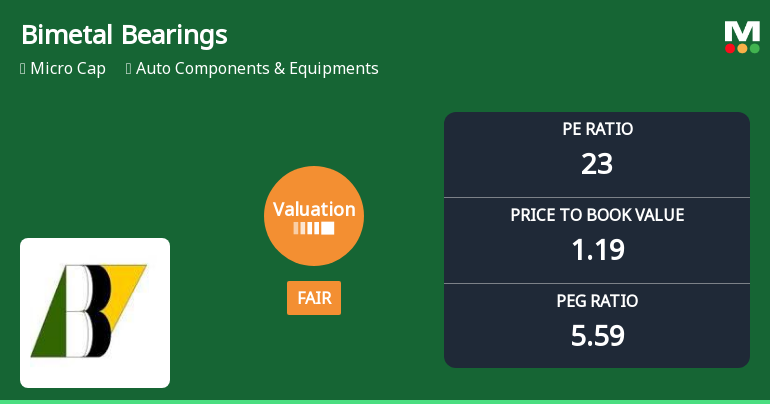
Bimetal Bearings Ltd, a micro-cap player in the Auto Components & Equipments sector, has witnessed a notable shift in its valuation parameters, moving from an attractive to a fair rating. This change reflects evolving market perceptions amid steady price gains and mixed financial metrics, prompting a reassessment of its price attractiveness relative to peers and historical benchmarks.
Read full news articleWe hereby inform that the Company has fixed 14th July 2026 as the record date for determining the eligible shareholders for the payment of dividend for FY 2025-26 subject to the approval of the members at the 65th AGM of the Company scheduled on 20th July 2026.
The Company is hereby submitting the copies of News Paper Advertisement in connection with the Notice of the 65th Annual General Meeting scheduled to be held on 20th July 2026 following the dispatch of the Annual Report 2026 to the shareholders
We enclose copies of the News Paper advertisements published in the English and Regional language regarding the transfer of unclaimed divided pertaining to FY 2018-19 and the corresponding equity shares to the account of IEPF in compliance with the applicable provisions of Companies Act 2013 and the IEPF Rules.

No Upcoming Board Meetings

Bimetal Bearings Ltd has declared 135% dividend, ex-date: 14 Jul 26

No Splits history available

No Bonus history available

No Rights history available
 Technical Indicator Scale: Bearish, Mildly Bearish, Sideways, Mildly Bullish, Bullish Turned
 Promoters
None
Held by 0 Schemes
Held by 0 FIIs
Simpson And Company Ltd (49.0%)
Sethuvenkatraman N Mr (1.02%)
23.4%

QoQ Growth in quarter ended Mar 2026 is 47.52% vs -4.81% in Dec 2025
QoQ Growth in quarter ended Mar 2026 is 122.22% vs -13.64% in Dec 2025
Growth in half year ended Sep 2025 is 14.82% vs 2.60% in Sep 2024
Growth in half year ended Sep 2025 is 3.67% vs -5.06% in Sep 2024
YoY Growth in nine months ended Dec 2025 is 15.85% vs 1.22% in Dec 2024

YoY Growth in nine months ended Dec 2025 is -8.00% vs 22.10% in Dec 2024
YoY Growth in year ended Mar 2026 is 24.22% vs 2.32% in Mar 2025
YoY Growth in year ended Mar 2026 is 4.18% vs 10.51% in Mar 2025


