
Compare AksharChem (I) with Similar Stocks
Dashboard
Weak Long Term Fundamental Strength with a -51.13% CAGR growth in Operating Profits over the last 5 years
- Company's ability to service its debt is weak with a poor EBIT to Interest (avg) ratio of 1.69
- The company has been able to generate a Return on Equity (avg) of 2.40% signifying low profitability per unit of shareholders funds
Flat results in Mar 26
Stock DNA
Dyes And Pigments
INR 203 Cr (Micro Cap)
NA (Loss Making)
20
0.32%
0.25
-0.81%
0.67
Total Returns (Price + Dividend) 
Latest dividend: 0.7 per share ex-dividend date: Sep-04-2025
Risk Adjusted Returns v/s
Returns Beta

News

AksharChem (India) Ltd is Rated Strong Sell
AksharChem (India) Ltd is rated Strong Sell by MarketsMOJO. This rating was last updated on 01 December 2025. However, the analysis and financial metrics discussed below reflect the stock's current position as of 12 June 2026, providing investors with an up-to-date view of the company’s fundamentals, returns, and market performance.
Read full news article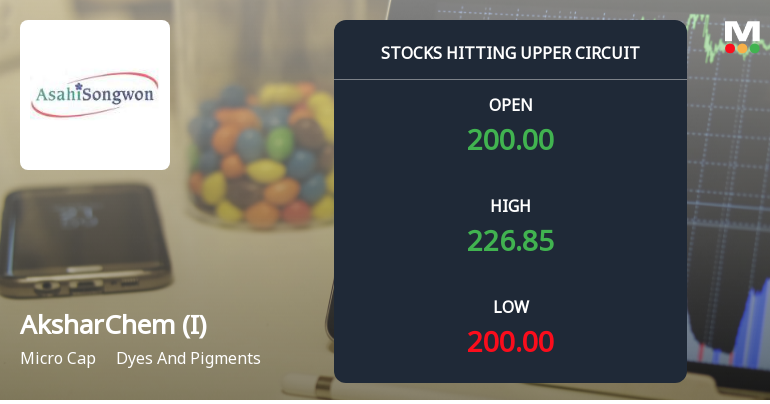
Micro-Cap AksharChem Locks at Upper Circuit — Rs 1.59 Crore Turnover and Rising Delivery Tell the Story
At Rs 229.2, the buying was done — not because demand dried up, but because the exchange wouldn't let the stock go any higher. AksharChem (India) Ltd locked at its upper circuit of 20% on 3 Jun 2026, with buyers queuing and no sellers willing to part with shares.
Read full news article
AksharChem (India) Ltd is Rated Strong Sell
AksharChem (India) Ltd is rated Strong Sell by MarketsMOJO. This rating was last updated on 01 Dec 2025, reflecting a reassessment of the stock’s outlook. However, the analysis and financial metrics presented here are based on the company’s current position as of 31 May 2026, providing investors with the latest insights into its performance and prospects.
Read full news article Announcements
Announcement under Regulation 30 (LODR)-Newspaper Publication
30-May-2026 | Source : BSEPublication of Postal Ballot Notice
Shareholder Meeting / Postal Ballot-Notice of Postal Ballot
29-May-2026 | Source : BSENotice of Postal Ballot
Announcement under Regulation 30 (LODR)-Newspaper Publication
22-May-2026 | Source : BSEPublication of Financial Result
Corporate Actions

No Upcoming Board Meetings

AksharChem (India) Ltd has declared 7% dividend, ex-date: 04 Sep 25

No Splits history available

No Bonus history available

No Rights history available
Quality key factors
Valuation key factors
Technicals key factors
 Technical Indicator Scale: Bearish, Mildly Bearish, Sideways, Mildly Bullish, Bullish Turned
 Shareholding Snapshot : Mar 2026
Shareholding Compare (%holding)
Promoters
None
Held by 1 Schemes (0.06%)
Held by 0 FIIs
Mrugesh Jaykrishna Family Trust - 2 (38.87%)
Tarak V Vora (2.31%)
27.44%
Quarterly Results Snapshot (Standalone) - Mar'26 - QoQ

QoQ Growth in quarter ended Mar 2026 is 31.61% vs -9.99% in Dec 2025
QoQ Growth in quarter ended Mar 2026 is 204.76% vs -237.23% in Dec 2025
Half Yearly Results Snapshot (Standalone) - Sep'25

Growth in half year ended Sep 2025 is 12.99% vs 13.70% in Sep 2024
Growth in half year ended Sep 2025 is -130.14% vs 116.87% in Sep 2024
Nine Monthly Results Snapshot (Standalone) - Dec'25
YoY Growth in nine months ended Dec 2025 is 4.35% vs 16.01% in Dec 2024
YoY Growth in nine months ended Dec 2025 is -256.21% vs 126.72% in Dec 2024
Annual Results Snapshot (Standalone) - Mar'26
YoY Growth in year ended Mar 2026 is 7.55% vs 14.64% in Mar 2025
YoY Growth in year ended Mar 2026 is -109.22% vs 125.54% in Mar 2025
About AksharChem (India) Ltd

Company Coordinates


