
Compare Summit Securitie with Similar Stocks
Stock DNA
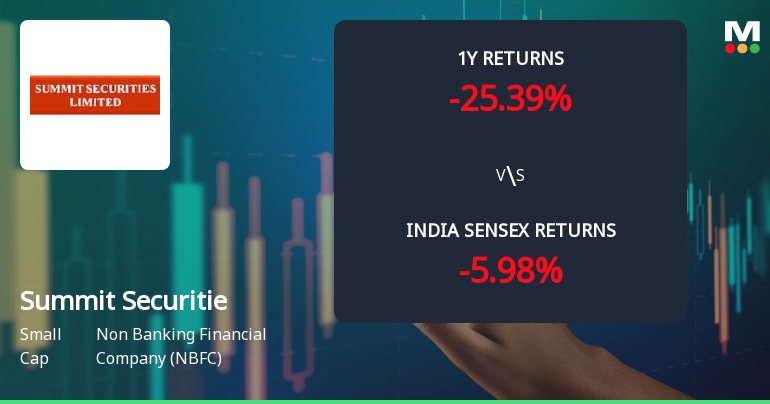
Non Banking Financial Company (NBFC)
INR 1,722 Cr (Small Cap)
16.00
21
0.00%
0.00
1.22%
0.20
Total Returns (Price + Dividend) 
Summit Securitie for the last several years.
Risk Adjusted Returns v/s
Returns Beta

News
Summit Securities Ltd Technical Momentum Shifts Amid Mixed Market Signals
Summit Securities Ltd, a small-cap player in the Non Banking Financial Company (NBFC) sector, has experienced a notable shift in its technical momentum, reflecting a complex interplay of bullish and bearish signals. Despite a recent 3.68% rise in its share price to ₹1,552.25, the company’s overall technical indicators present a nuanced picture that investors must carefully analyse amid a challenging market backdrop.
Read full news article
Summit Securities Ltd is Rated Strong Sell
Summit Securities Ltd is rated Strong Sell by MarketsMOJO, with this rating last updated on 29 April 2026. However, the analysis and financial metrics discussed here reflect the stock’s current position as of 14 June 2026, providing investors with the most recent and relevant data to assess the company’s outlook.
Read full news article
Summit Securities Ltd is Rated Strong Sell
Summit Securities Ltd is rated Strong Sell by MarketsMOJO, with this rating last updated on 29 April 2026. However, the analysis and financial metrics discussed here reflect the stock's current position as of 03 June 2026, providing investors with the latest insights into the company’s performance and outlook.
Read full news article Announcements
Announcement under Regulation 30 (LODR)-Newspaper Publication
11-Jun-2026 | Source : BSESubmission of Newspaper Publication intimating that the 29th Annual General Meeting of the Company will be held on Thursday July 30 2026 at 03.00 p.m. (IST) through Video Conferencing / Other Audio Visual Means.
Announcement under Regulation 30 (LODR)-Newspaper Publication
09-Jun-2026 | Source : BSESubmission of Newspaper Publication regarding Special Window.
Compliances-Reg.24(A)-Annual Secretarial Compliance
18-May-2026 | Source : BSEPursuant to Regulation 24A of Securities and Exchange Board of India (Listing Obligations and Disclosure Requirements) Regulations 2015 please find enclosed herewith the Annual Secretarial Compliance Report for the year ended March 31 2026 issued by M/s. Parikh Parekh & Associates Practicing Company Secretaries.
Corporate Actions

No Upcoming Board Meetings

No Dividend history available

No Splits history available

No Bonus history available

No Rights history available
Quality key factors
Valuation key factors
Technicals key factors
 Technical Indicator Scale: Bearish, Mildly Bearish, Sideways, Mildly Bullish, Bullish Turned
 Shareholding Snapshot : Mar 2026
Shareholding Compare (%holding)
Promoters
None
Held by 11 Schemes (0.0%)
Held by 57 FIIs (0.08%)
Swallow Associates Llp (70.57%)
Seetha Kumari (1.71%)
18.61%
Quarterly Results Snapshot (Consolidated) - Mar'26 - YoY

YoY Growth in quarter ended Mar 2026 is 16.51% vs -50.10% in Mar 2025

YoY Growth in quarter ended Mar 2026 is -400.86% vs -132.22% in Mar 2025
Half Yearly Results Snapshot (Consolidated) - Sep'25
Growth in half year ended Sep 2025 is 15.45% vs 97.12% in Sep 2024
Growth in half year ended Sep 2025 is 41.93% vs 67.31% in Sep 2024
Nine Monthly Results Snapshot (Consolidated) - Dec'25
YoY Growth in nine months ended Dec 2025 is 31.39% vs 55.67% in Dec 2024
YoY Growth in nine months ended Dec 2025 is 74.59% vs 19.42% in Dec 2024
Annual Results Snapshot (Consolidated) - Mar'26
YoY Growth in year ended Mar 2026 is 21.05% vs 16.43% in Mar 2025
YoY Growth in year ended Mar 2026 is 52.52% vs -9.42% in Mar 2025
About Summit Securities Ltd

Company Coordinates


