
Compare Gratex Industrie with Similar Stocks
Dashboard
Weak Long Term Fundamental Strength with an average Return on Equity (ROE) of 2.80%
- Poor long term growth as Operating profit has grown by an annual rate 3.19% of over the last 5 years
- Company's ability to service its debt is weak with a poor EBIT to Interest (avg) ratio of 0.17
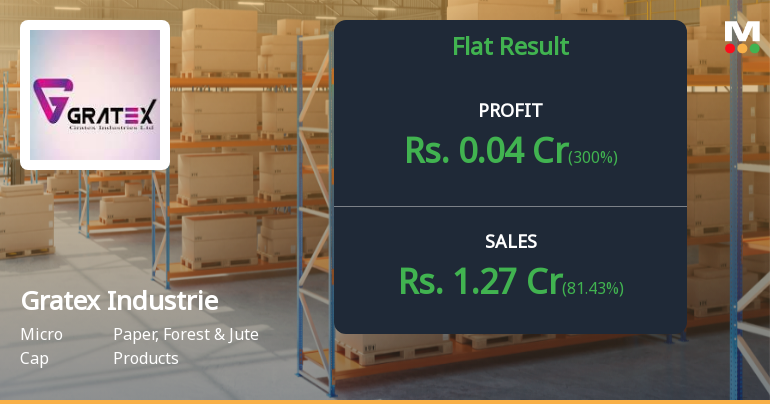
Flat results in Mar 26
With ROE of 3.3, it has a Very Expensive valuation with a 2.1 Price to Book Value
Stock DNA
Paper, Forest & Jute Products
INR 8 Cr (Micro Cap)
66.00
23
0.00%
0.01
3.25%
2.14
Total Returns (Price + Dividend) 
Gratex Industrie for the last several years.
Risk Adjusted Returns v/s
Returns Beta

News
Gratex Industries Q4 FY26: Micro-Cap Paper Maker Posts Modest Recovery Amid Valuation Concerns
Gratex Industries Ltd., a micro-cap paper and paper products manufacturer, reported a modest recovery in its March 2026 quarter results, with net profit reaching ₹0.04 crores compared to ₹0.01 crores in the year-ago period. However, the ₹7.00 crore market capitalisation company continues to grapple with wafer-thin margins and elevated valuations that raise questions about its investment appeal.
Read full news article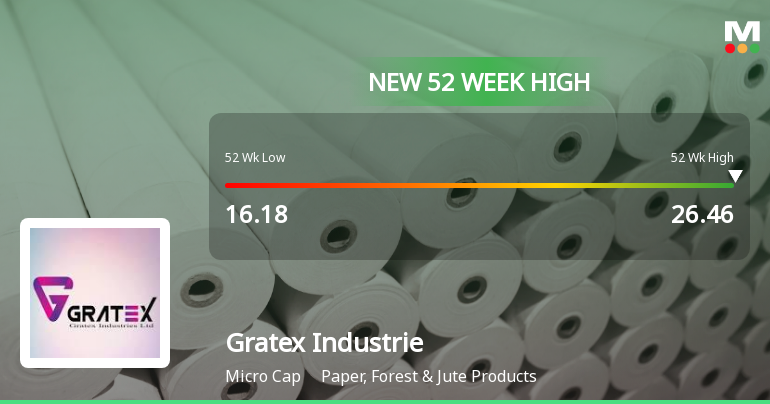
Broad-Based Technical Strength Lifts Gratex Industries Ltd to 52-Week High of Rs 26.46
With a decisive surge to Rs 26.46 on 22 May 2026, Gratex Industries Ltd has reached a fresh 52-week high, marking a 45.46% gain over the past year and significantly outperforming the Sensex’s decline of 6.65% during the same period. This milestone caps a four-day winning streak that has propelled the stock 18.39% higher, underscoring robust momentum driven by a confluence of technical indicators.
Read full news article
Gratex Industries Ltd Upgraded to Sell on Technical Improvements Despite Fundamental Challenges
Gratex Industries Ltd, a micro-cap player in the Paper, Forest & Jute Products sector, has seen its investment rating upgraded from Strong Sell to Sell as of 6 May 2026. This change reflects a nuanced shift in the company’s technical outlook amid persistent fundamental weaknesses, prompting a reassessment of its near-term prospects despite ongoing valuation and financial concerns.
Read full news article Announcements
Compliances-Certificate under Reg. 74 (5) of SEBI (DP) Regulations 2018
07-Jul-2026 | Source : BSECertificate under Regulation 74(5) of SEBI (DP) Regulations 2018 for the quarter ended on June 30 2026
Closure of Trading Window
24-Jun-2026 | Source : BSEClosure of Trading Window from 01st July 2026 upto the expiry of 48 hours post the declaration of Unaudited Financial Results for the quarter ended on 30th June 2026.
Announcement under Regulation 30 (LODR)-Newspaper Publication
27-May-2026 | Source : BSENewspaper Publication of Audited Financial Results for Quarter and Year Ended on 31st March 2026.
Corporate Actions

No Upcoming Board Meetings

No Dividend history available

No Splits history available

No Bonus history available

No Rights history available
Quality key factors
Valuation key factors
Technicals key factors
 Technical Indicator Scale: Bearish, Mildly Bearish, Sideways, Mildly Bullish, Bullish Turned
 Shareholding Snapshot : Jun 2026
Shareholding Compare (%holding)
Promoters
None
Held by 0 Schemes
Held by 0 FIIs
Baldevkrishan Sharma (46.89%)
Surekha Mahendra Khetani (1.63%)
33.34%
Quarterly Results Snapshot (Standalone) - Mar'26 - YoY

YoY Growth in quarter ended Mar 2026 is 81.43% vs -25.53% in Mar 2025
YoY Growth in quarter ended Mar 2026 is 300.00% vs -66.67% in Mar 2025
Half Yearly Results Snapshot (Standalone) - Sep'25

Growth in half year ended Sep 2025 is -1.47% vs 1.49% in Sep 2024
Growth in half year ended Sep 2025 is 150.00% vs -50.00% in Sep 2024
Nine Monthly Results Snapshot (Standalone) - Dec'25
YoY Growth in nine months ended Dec 2025 is -1.64% vs -0.33% in Dec 2024
YoY Growth in nine months ended Dec 2025 is 14.29% vs 16.67% in Dec 2024
Annual Results Snapshot (Standalone) - Mar'26
YoY Growth in year ended Mar 2026 is 13.87% vs -6.02% in Mar 2025
YoY Growth in year ended Mar 2026 is 57.14% vs -22.22% in Mar 2025
About Gratex Industries Ltd

Company Coordinates


