Piccadily Sugar

  • Market Cap: Micro Cap
  • Industry: Sugar
  • ISIN: INE544C01023
  • NSEID:
  • BSEID: 507498
INR
33.74
1.36 (4.2%)
BSENSE

Feb 03

BSE+NSE Vol: 11582

  • Price Points
  • Score
  • Mojo Parameters
  • Total Return
  • News and Corporate Actions
  • Key factors
  • Shareholding
  • Financials
  • CompanyCV
stock-summaryPrice Point
High/Low

1Day

52 Week

Valuation
Technical
Day's Volume

CASH

11.58 k (101.73%) Volume

Shareholding (Dec 2025)

FII

0.00%

Held by 0 FIIs

DII

0.00%

Held by 0 DIIs

Promoter

74.98%

Who are the top shareholders of the Piccadily Sugar?

06-Jun-2025

The top shareholders of Piccadily Sugar include Piccadily Agro Industries Limited with a 35.87% stake and individual investors holding 24.47%. There are no mutual funds or foreign institutional investors involved, and no promoter holdings are pledged.

The top shareholders of Piccadily Sugar primarily include the promoters, with Piccadily Agro Industries Limited holding the largest stake at 35.87%. Individual investors collectively own 24.47% of the company. There are currently no mutual funds or foreign institutional investors (FIIs) holding shares in Piccadily Sugar, and there are no pledged promoter holdings.

View full answer

how big is Piccadily Sugar?

06-Jun-2025

As of Jun 06, Piccadily Sugar & Allied Inds Ltd has a market capitalization of 120.92 Cr, classifying it as a Micro Cap company, with recent net sales of 31.38 Cr and a net profit of 3.20 Cr over the last four quarters.

Market Cap: As of Jun 06, Piccadily Sugar & Allied Inds Ltd has a market capitalization of 120.92 Cr, which classifies it as a Micro Cap company.<BR><BR>Recent Quarterly Performance: The sum of Net Sales for the latest 4 quarters, which includes Dec'21, Sep'21, Jun'21, and Mar'21, is 31.38 Cr. The sum of Net Profit for the same period is 3.20 Cr. This data is consolidated.<BR><BR>Balance Sheet Snapshot: This is consolidated data for the latest annual period ending Mar'21. The Shareholder's Funds are reported at 16.20 Cr, while the Total Assets amount to 49.19 Cr.

View full answer

Who are in the management team of Piccadily Sugar?

06-Jun-2025

As of March 2023, the management team of Piccadily Sugar includes Harvinder Singh Chopra, Jai Parkash Kaushik (Independent Directors), Madhu Sharma (Non Executive Director), Naveen Pawar (Chairman & Wholetime Director), and Kajal Goel (Company Secretary & Compliance Officer).

As of March 2023, the management team of Piccadily Sugar includes the following individuals:<BR><BR>1. Harvinder Singh Chopra - Independent Director<BR>2. Madhu Sharma - Non Executive Director<BR>3. Jai Parkash Kaushik - Independent Director<BR>4. Naveen Pawar - Chairman & Wholetime Director<BR>5. Kajal Goel - Company Secretary & Compliance Officer<BR><BR>These members play various roles in the governance and management of the company.

View full answer

What does Piccadily Sugar do?

06-Jun-2025

Piccadily Sugar & Allied Inds Ltd manufactures White Crystal Sugar and alcoholic beverages, categorized as a micro-cap company with a market cap of Rs 125 Cr. As of March 2025, it reported net sales and net profit of 0 Cr.

Overview: <BR>Piccadily Sugar & Allied Inds Ltd operates in the sugar industry, manufacturing White Crystal Sugar and various alcoholic beverages, and is categorized as a micro-cap company.<BR><BR>History: <BR>The company was incorporated in March 1993 in the assisted sector by the Punjab State Industrial Development Corporation and others. The latest quarterly results reported net sales and net profit of 0 Cr for March 2025.<BR><BR>Financial Snapshot: <BR>Most recent Net Sales: 0 Cr (Quarterly Results - Mar 2025) <BR>Most recent Net Profit: 0 Cr (Quarterly Results - Mar 2025) <BR>Market-cap value: Rs 125 Cr (Micro Cap)<BR><BR>Key Metrics: <BR>P/E: N/A <BR>Industry P/E: 25 <BR>Dividend Yield: 0.00% <BR>Debt-Equity: 2.00 <BR>Return on Equity: -28.31% <BR>Price to Book: 10.81<BR><BR>Contact Details: <BR>Address: Jakhal Road, Patran Patiala Punjab : 147001 <BR>Tel: 91-01764-242501/242020 <BR>Email: Piccadilygroup34@rediffmail.com <BR>Website: http://www.psailpatran.com

View full answer

Has Piccadily Sugar declared dividend?

06-Jun-2025

No Dividend History Available

Who are the peers of the Piccadily Sugar?

03-Jun-2025

Piccadily Sugar's peers include Balrampur Chini, Triven. Engg. Ind., Sh. Renuka Sugar, and others, with varying management risks and growth rates. Balrampur Chini leads in 1-year returns at 52.26%, while Piccadily Sugar has a return of -21.98%.

Peers: The peers of Piccadily Sugar are Balrampur Chini, Triven.Engg.Ind., Sh.Renuka Sugar, Piccadily Agro, Bannari Amm.Sug., Parvati Sweetner, Dhampur.Spl.Sug., Kesar Enterprise, Gayatri Sugars.<BR><BR>Quality Snapshot: Excellent management risk is observed at Balrampur Chini and Triven.Engg.Ind., while Average management risk is found at Piccadily Agro, Bannari Amm.Sug., and Kesar Enterprise, and the rest have Below Average management risk. Growth is Good at Piccadily Agro, while Below Average growth is seen in Balrampur Chini, Triven.Engg.Ind., Sh.Renuka Sugar, Bannari Amm.Sug., Parvati Sweetner, and Kesar Enterprise, with the rest also showing Below Average growth. Average capital structure is noted for Balrampur Chini, Triven.Engg.Ind., Piccadily Agro, Bannari Amm.Sug., and Kesar Enterprise, while Below Average capital structure is found in Sh.Renuka Sugar, Piccadily Sugar, Parvati Sweetner, Dhampur.Spl.Sug., and Gayatri Sugars.<BR><BR>Return Snapshot: The peer with the highest 1-year return is Balrampur Chini at 52.26%, while Kesar Enterprise has the lowest at -55.11%. Piccadily Sugar's 1-year return is -21.98%, which is higher than Kesar Enterprise's but lower than Balrampur Chini's. Additionally, several peers, including Sh.Renuka Sugar, Piccadily Agro, Parvati Sweetner, Dhampur.Spl.Sug., Kesar Enterprise, Gayatri Sugars, and Simbhaoli Sugar, have negative six-month returns.

View full answer

Is Piccadily Sugar overvalued or undervalued?

09-Jun-2025

As of April 25, 2023, Piccadily Sugar is considered overvalued and risky, with a negative PE ratio of -37.90 and poor performance compared to peers and the Sensex, reflecting significant financial struggles.

As of 25 April 2023, the valuation grade for Piccadily Sugar has moved from does not qualify to risky, indicating a significant shift in the company's perceived financial health. The company is currently overvalued, as evidenced by its negative PE ratio of -37.90, an EV to EBITDA of -40.19, and a ROE of -28.31%. These ratios suggest that the company is struggling to generate profits relative to its equity and earnings.<BR><BR>In comparison to its peers, Piccadily Sugar's valuation metrics are starkly unfavorable. For instance, EID Parry has a PE ratio of 27.55 and an EV to EBITDA of 5.63, while Balrampur Chini shows a PE of 28.14 and an EV to EBITDA of 21.19, both indicating a much healthier financial position. Additionally, the stock has underperformed relative to the Sensex, with a year-to-date return of -22.15% compared to the Sensex's positive 5.59% return. This further reinforces the conclusion that Piccadily Sugar is currently overvalued in the market.

View full answer

What is the technical trend for Piccadily Sugar?

09-Jun-2025

As of June 2, 2025, Piccadily Sugar's technical trend is mildly bearish, with conflicting indicators showing a mildly bullish weekly MACD but bearish signals from Bollinger Bands and moving averages.

As of 2 June 2025, the technical trend for Piccadily Sugar has changed from bearish to mildly bearish. The weekly MACD indicates a mildly bullish stance, while the monthly MACD shows a mildly bearish trend. The Bollinger Bands are bearish on both weekly and monthly time frames, and daily moving averages are also bearish. The KST reflects a mildly bullish trend weekly but is mildly bearish monthly. Dow Theory suggests a mildly bullish trend on the weekly chart, with no clear trend on the monthly. Overall, the current technical stance is mildly bearish, with key indicators such as the moving averages and Bollinger Bands contributing to this outlook.

View full answer

How has been the historical performance of Piccadily Sugar?

17-Nov-2025

Piccadily Sugar's historical performance shows significant fluctuations, with net sales declining from 43.61 Cr in March 2020 to 23.75 Cr in March 2021, although operating profit improved to 4.41 Cr and profit after tax rose to 0.91 Cr in the same period. Despite challenges in sales, the company enhanced its profitability metrics.

Answer:<BR>The historical performance of Piccadily Sugar shows significant fluctuations over the past three years.<BR><BR>Breakdown:<BR>In the fiscal year ending March 2021, Piccadily Sugar reported net sales of 23.75 Cr, a notable decline from 43.61 Cr in March 2020 and 39.10 Cr in March 2019. The total operating income mirrored this trend, remaining at 23.75 Cr in March 2021, down from 43.61 Cr in the previous year. The company's total expenditure also decreased to 24.79 Cr in March 2021 from 43.41 Cr in March 2020. Operating profit (PBDIT) showed a recovery to 4.41 Cr in March 2021, compared to 1.52 Cr in March 2020, although it was lower than the 3.32 Cr reported in March 2019. Profit after tax saw a significant increase to 0.91 Cr in March 2021 from just 0.02 Cr in March 2020, while the earnings per share rose to 0.39 from 0.01 in the same period. The company's total liabilities decreased to 49.19 Cr in March 2021 from 50.95 Cr in March 2020, and total assets also fell to 49.19 Cr from 50.95 Cr. Overall, while the company faced challenges in sales and operating income, it managed to improve its profitability metrics in the latest fiscal year.

View full answer

When is the next results date for Piccadily Sugar & Allied Inds Ltd?

13-Jan-2026

The next results date for Piccadily Sugar & Allied Inds Ltd is January 20, 2026.

The next results date for Piccadily Sugar & Allied Inds Ltd is scheduled for January 20, 2026.

View full answer

Should I buy, sell or hold Piccadily Sugar & Allied Inds Ltd?

20-Jan-2026

Are Piccadily Sugar & Allied Inds Ltd latest results good or bad?

21-Jan-2026

Piccadily Sugar & Allied Industries Ltd's latest results are concerning, with a 70.83% decline in net profit despite a 9.23% revenue increase, largely due to high tax burdens and reduced margins. Overall, the company's financial health appears precarious, indicating caution for investors.

The latest results for Piccadily Sugar & Allied Industries Ltd indicate a challenging situation for the company. In Q3 FY26, the company reported a net profit of ₹0.07 crores, which represents a significant decline of 70.83% compared to the previous quarter. While revenue grew by 9.23% quarter-on-quarter to ₹8.40 crores, this growth did not translate into profitability, largely due to an unusually high tax burden and compressed margins.<BR><BR>The operating margin fell to 8.69%, down from 13.13% in the previous quarter, and the PAT margin also contracted to 0.83% from 3.12%. The effective tax rate of 86.36% in this quarter severely impacted the bottom line, raising concerns about the company's tax provisioning.<BR><BR>Despite showing a marginal profit compared to a loss in the same quarter last year, the overall financial performance reflects structural challenges within the company and the broader sugar sector. The stock has also been underperforming, with a significant decline of 33.47% over the past six months.<BR><BR>In summary, while there are some positive indicators like revenue growth, the overall results are concerning due to the drastic drop in profitability and ongoing operational challenges. The situation suggests that the company's financial health remains precarious, warranting caution for investors.

View full answer

Why is Piccadily Sugar & Allied Inds Ltd falling/rising?

01-Feb-2026

As of 01-Feb, the stock price of Piccadily Sugar & Allied Inds Ltd is slightly rising at 33.39, following a trend reversal after four days of decline. Despite this short-term increase, the stock has significant long-term declines, with a year-to-date drop of 16.75% and a one-year decline of 45.79%, indicating a bearish trend overall.

As of 01-Feb, the stock price of Piccadily Sugar & Allied Inds Ltd is rising slightly, with a current price of 33.39, reflecting a change of 0.04 (0.12%) upward. This rise comes after a trend reversal, as the stock has gained after four consecutive days of decline. Additionally, the stock has outperformed its sector by 1.58% today, indicating a relative strength compared to its peers.<BR><BR>Despite this short-term increase, the stock has shown significant declines over longer periods, with a year-to-date drop of 16.75% and a one-year decline of 45.79%. It is also trading below its moving averages across various time frames, which suggests a longer-term bearish trend. However, there has been a notable increase in investor participation, with delivery volume rising by 186.03% against the five-day average, indicating growing interest from investors.<BR><BR>Overall, while the stock is experiencing a minor rise today, it is important to consider the broader context of its recent performance and the prevailing downward trends over the past months and year.

View full answer
iScoreScore
Click here to find our call on this stock
Strong Sell
Sell
Hold
Buy
Strong Buy

MarketsMojo — Loved in India, Now Global

The power of Mojo is now in 29 countries. Explore global equities with the same cutting-edge features you love.

Dashboard

Icon
Unrated Stock - No Analysis Available
stock-summaryMojo Parameters

Mojo Parameters

Loading Valuation Snapshot...

Stock DNA

stock-summary
Industry

Sugar

stock-summary
Market cap

INR 73 Cr (Micro Cap)

stock-summary
P/E

42.00

stock-summary
Industry P/E

20

stock-summary
Dividend Yield

0.00%

stock-summary
Debt Equity

1.67

stock-summary
Return on Equity

14.62%

stock-summary
Price to Book

5.91

Revenue and Profits:
Net Sales:
1 Cr
(Quarterly Results - Dec 2025)
Net Profit:
0 Cr
stock-summaryTotal Returns
Total Returns (Price + Dividend) stock-summary
Dividend Yield (0%)
TimePeriod
Price Return
Dividend Return
Total Return
3 Months
-29.87%
0%
-29.87%
6 Months
-33.25%
0%
-33.25%
1 Year
-44.23%
0%
-44.23%
2 Years
-54.47%
0%
-54.47%
3 Years
96.16%
0%
96.16%
4 Years
95.59%
0%
95.59%
5 Years
577.51%
0%
577.51%

Piccadily Sugar for the last several years.

Risk Adjusted Returns v/s stock-summary
Returns Beta
Icon
Beta has not been calculated since enough price history is not available
stock-summaryNews & Corporate Actions

News

Why is Piccadily Sugar & Allied Inds Ltd falling/rising?

Recent Price Movement and Market Context

Piccadily Sugar’s share price has been under pressure over multiple time horizons. In the past week, the stock has declined by 10.71%, sharply contrasting with the Sensex’s modest gain of 0.16% during the same period. This negative trend extends to the one-month and year-to-date (YTD) frames, where the stock has fallen 20.25% and 18.97% respectively, while the Sensex has declined by 4.78% and 4.17%. The disparity is even more pronounced over the last year, with Piccadily Sugar plunging 46.41%, whereas the Sensex has appreciated by 5.37%.

Despite this recent weakness, the stock’s longer-term performance remains impressive, having delivered a cumulative gain of 83.10% over three years and an extraordinary 557.89% over five years, ...

Read full news article
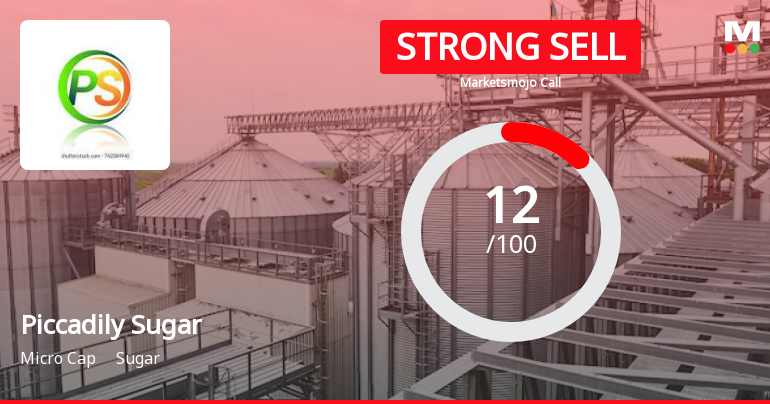
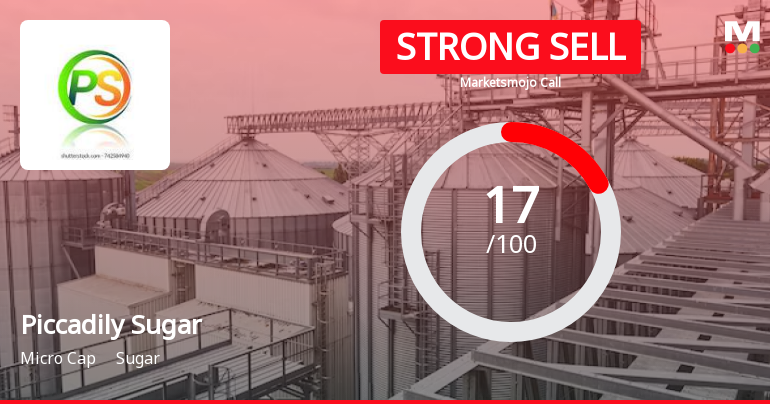
Piccadily Sugar Declines 1.38%: 3 Key Factors Behind the Weekly Slide

Announcements stock-summary

Board Meeting Intimation for To Consider And Approve Non-Convertible Cumulative Non-Participating Redeemable Preference Shares On A Private Placement Basis (NCRPS).

30-Jan-2026 | Source : BSE

Piccadily Sugar & Allied Industries Ltdhas informed BSE that the meeting of the Board of Directors of the Company is scheduled on 05/02/2026 inter alia to consider and approve non-convertible cumulative non-participating redeemable preference shares on a private placement basis (NCRPS)of 10000000 (One Crore) for an aggregate value not exceeding Rs. 100000000 (Ten Crores ).

Announcement under Regulation 30 (LODR)-Newspaper Publication

22-Jan-2026 | Source : BSE

Un-audited Financial Results of the company as on 31.12.2025.

Unaudited Financial Results For Quarter Ended On 31-12-2025

20-Jan-2026 | Source : BSE

Unaudited Financial Results For Quarter Ended on 31-12-2025

Corporate Actions stock-summary

stock-summary
BOARD MEETING

05 Feb 2026

stock-summary
DIVIDEND

No Dividend history available

stock-summary
SPLITS

No Splits history available

stock-summary
BONUS

No Bonus history available

stock-summary
RIGHTS

No Rights history available

stock-summaryKey Factors

Quality key factors stock-summary

Factor
Value
Sales Growth (5y)
-46.80%
EBIT Growth (5y)
1.71%
EBIT to Interest (avg)
-4.95
Debt to EBITDA (avg)
Negative Net Debt
Net Debt to Equity (avg)
1.67
Sales to Capital Employed (avg)
0.74
Tax Ratio
Tax Ratio is Negative%
Dividend Payout Ratio
0
Pledged Shares
0
Institutional Holding
0
ROCE (avg)
-20.98%
ROE (avg)
3.28%

Valuation key factors

Factor
Value
P/E Ratio
42
Industry P/E
20
Price to Book Value
6.13
EV to EBIT
-26.83
EV to EBITDA
-71.28
EV to Capital Employed
2.92
EV to Sales
99.79
PEG Ratio
0.28
Dividend Yield
NA
ROCE (Latest)
-16.38%
ROE (Latest)
14.62%

Technicals key factors

Indicator
Weekly
Monthly
MACD
Bearish
Bearish
RSI
Bullish
Bullish
Bollinger Bands
Mildly Bearish
Mildly Bearish
Moving Averages
Bearish (Daily)
KST
Bearish
Bearish
Dow Theory
Mildly Bearish
Mildly Bearish
stock-summary Technical Indicator Scale: Bearish, Mildly Bearish, Sideways, Mildly Bullish, Bullish  Turned 
stock-summaryShareholding
Shareholding Snapshot : Dec 2025stock-summary
Shareholding Compare (%holding) stock-summary
Majority shareholders

Promoters

Pledged Promoter Holdings

None

Mutual Funds

Held by 0 Schemes

FIIs

Held by 0 FIIs

Promoter with highest holding

Piccadily Agro Industries Limited (35.87%)

Highest Public shareholder

None

Individual Investors Holdings

24.52%

stock-summaryFinancial
[
  {
    "link": "quarterly",
    "btn_text": "All Quarterly Results",
    "header": "Quarterly Results Snapshot (Standalone) - Dec'25 - YoY",
    "rhs": [
      {
        "prefix": "Net Sales ",
        "suffix": "YoY Growth in quarter ended Dec 2025 is -37.21% vs 27.72% in Dec 2024",
        "dir": -1
      },
      {
        "prefix": "Standalone Net Profit ",
        "suffix": "YoY Growth in quarter ended Dec 2025 is -73.97% vs 152.90% in Dec 2024",
        "dir": -1
      }
    ],
    "table": {
      "header": [
        "Dec'25",
        "Dec'24",
        "Change(%)"
      ],
      "body": [
        {
          "field": "Net Sales",
          "val1": "0.81",
          "val2": "1.29",
          "chgp": "-37.21%",
          "chgp_class": "negative"
        },
        {
          "field": "Operating Profit (PBDIT) excl Other Income",
          "val1": "-0.30",
          "val2": "-2.04",
          "chgp": "85.29%",
          "chgp_class": "positive"
        },
        {
          "field": "Interest",
          "val1": "0.00",
          "val2": "0.00",
          "chgp": "",
          "chgp_class": "neutral"
        },
        {
          "field": "Exceptional Items",
          "val1": "0.00",
          "val2": "2.28",
          "chgp": "-100.00%",
          "chgp_class": "negative"
        },
        {
          "field": "Standalone Net Profit",
          "val1": "0.19",
          "val2": "0.73",
          "chgp": "-73.97%",
          "chgp_class": "negative"
        },
        {
          "field": "Operating Profit Margin (Excl OI)",
          "val1": "-37.04%",
          "val2": "-158.14%",
          "chgp": "121.10%",
          "chgp_class": "positive"
        }
      ]
    }
  },
  {
    "link": "half-yearly",
    "btn_text": "All Half Yearly Results",
    "header": "Half Yearly Results Snapshot (Standalone) - Sep'25",
    "rhs": [
      {
        "prefix": "Net Sales ",
        "suffix": " Growth in half year ended Sep 2025 is -100.00% vs -2.68% in Sep 2024",
        "dir": -1
      },
      {
        "prefix": "Standalone Net Profit ",
        "suffix": " Growth in half year ended Sep 2025 is 184.44% vs -33.33% in Sep 2024",
        "dir": 1
      }
    ],
    "table": {
      "header": [
        "Sep'25",
        "Sep'24",
        "Change(%)"
      ],
      "body": [
        {
          "field": "Net Sales",
          "val1": "0.00",
          "val2": "2.90",
          "chgp": "-100.00%",
          "chgp_class": "negative"
        },
        {
          "field": "Operating Profit (PBDIT) excl Other Income",
          "val1": "-0.52",
          "val2": "-0.97",
          "chgp": "46.39%",
          "chgp_class": "positive"
        },
        {
          "field": "Interest",
          "val1": "0.00",
          "val2": "0.00",
          "chgp": "",
          "chgp_class": "neutral"
        },
        {
          "field": "Exceptional Items",
          "val1": "0.00",
          "val2": "0.00",
          "chgp": "",
          "chgp_class": "neutral"
        },
        {
          "field": "Standalone Net Profit",
          "val1": "1.52",
          "val2": "-1.80",
          "chgp": "184.44%",
          "chgp_class": "positive"
        },
        {
          "field": "Operating Profit Margin (Excl OI)",
          "val1": "0.00%",
          "val2": "-33.45%",
          "chgp": "33.45%",
          "chgp_class": "positive"
        }
      ]
    }
  },
  {
    "link": "nine-monthly",
    "btn_text": "All Nine Monthly Results",
    "header": "Nine Monthly Results Snapshot (Standalone) - Dec'25",
    "rhs": [
      {
        "prefix": "Net Sales ",
        "suffix": "YoY Growth in nine months ended Dec 2025 is -80.67% vs 5.01% in Dec 2024",
        "dir": -1
      },
      {
        "prefix": "Standalone Net Profit ",
        "suffix": "YoY Growth in nine months ended Dec 2025 is 259.81% vs 60.81% in Dec 2024",
        "dir": 1
      }
    ],
    "table": {
      "header": [
        "Dec'25",
        "Dec'24",
        "Change(%)"
      ],
      "body": [
        {
          "field": "Net Sales",
          "val1": "0.81",
          "val2": "4.19",
          "chgp": "-80.67%",
          "chgp_class": "negative"
        },
        {
          "field": "Operating Profit (PBDIT) excl Other Income",
          "val1": "-0.82",
          "val2": "-3.01",
          "chgp": "72.76%",
          "chgp_class": "positive"
        },
        {
          "field": "Interest",
          "val1": "0.00",
          "val2": "0.00",
          "chgp": "",
          "chgp_class": "neutral"
        },
        {
          "field": "Exceptional Items",
          "val1": "0.00",
          "val2": "2.28",
          "chgp": "-100.00%",
          "chgp_class": "negative"
        },
        {
          "field": "Standalone Net Profit",
          "val1": "1.71",
          "val2": "-1.07",
          "chgp": "259.81%",
          "chgp_class": "positive"
        },
        {
          "field": "Operating Profit Margin (Excl OI)",
          "val1": "-101.23%",
          "val2": "-71.84%",
          "chgp": "-29.39%",
          "chgp_class": "negative"
        }
      ]
    }
  },
  {
    "link": "annual",
    "btn_text": "All Annual Results",
    "header": "Annual Results Snapshot (Standalone) - Mar'25",
    "rhs": [
      {
        "prefix": "Net Sales ",
        "suffix": "YoY Growth in year ended Mar 2025 is -11.78% vs -72.25% in Mar 2024",
        "dir": 1
      },
      {
        "prefix": "Standalone Net Profit ",
        "suffix": "YoY Growth in year ended Mar 2025 is 52.11% vs 8.21% in Mar 2024",
        "dir": 1
      }
    ],
    "table": {
      "header": [
        "Mar'25",
        "Mar'24",
        "Change(%)"
      ],
      "body": [
        {
          "field": "Net Sales",
          "val1": "4.27",
          "val2": "4.84",
          "chgp": "-11.78%",
          "chgp_class": "negative"
        },
        {
          "field": "Operating Profit (PBDIT) excl Other Income",
          "val1": "-3.57",
          "val2": "-3.13",
          "chgp": "-14.06%",
          "chgp_class": "negative"
        },
        {
          "field": "Interest",
          "val1": "0.00",
          "val2": "0.03",
          "chgp": "-100.00%",
          "chgp_class": "positive"
        },
        {
          "field": "Exceptional Items",
          "val1": "2.28",
          "val2": "2.61",
          "chgp": "-12.64%",
          "chgp_class": "negative"
        },
        {
          "field": "Standalone Net Profit",
          "val1": "-0.91",
          "val2": "-1.90",
          "chgp": "52.11%",
          "chgp_class": "positive"
        },
        {
          "field": "Operating Profit Margin (Excl OI)",
          "val1": "-83.61%",
          "val2": "-64.67%",
          "chgp": "-18.94%",
          "chgp_class": "negative"
        }
      ]
    }
  }
]

Quarterly Results Snapshot (Standalone) - Dec'25 - YoYstock-summary

Dec'25
Dec'24
Change(%)
Net Sales
0.81
1.29
-37.21%
Operating Profit (PBDIT) excl Other Income
-0.30
-2.04
85.29%
Interest
0.00
0.00
Exceptional Items
0.00
2.28
-100.00%
Standalone Net Profit
0.19
0.73
-73.97%
Operating Profit Margin (Excl OI)
-37.04%
-158.14%
121.10%
Values in Rs Cr.
Direction Arrows
Net Sales

YoY Growth in quarter ended Dec 2025 is -37.21% vs 27.72% in Dec 2024

Direction Arrows
Standalone Net Profit

YoY Growth in quarter ended Dec 2025 is -73.97% vs 152.90% in Dec 2024

Half Yearly Results Snapshot (Standalone) - Sep'25stock-summary

Sep'25
Sep'24
Change(%)
Net Sales
0.00
2.90
-100.00%
Operating Profit (PBDIT) excl Other Income
-0.52
-0.97
46.39%
Interest
0.00
0.00
Exceptional Items
0.00
0.00
Standalone Net Profit
1.52
-1.80
184.44%
Operating Profit Margin (Excl OI)
0.00%
-33.45%
33.45%
Values in Rs Cr.
Direction Arrows
Net Sales

Growth in half year ended Sep 2025 is -100.00% vs -2.68% in Sep 2024

Direction Arrows
Standalone Net Profit

Growth in half year ended Sep 2025 is 184.44% vs -33.33% in Sep 2024

Nine Monthly Results Snapshot (Standalone) - Dec'25stock-summary

Dec'25
Dec'24
Change(%)
Net Sales
0.81
4.19
-80.67%
Operating Profit (PBDIT) excl Other Income
-0.82
-3.01
72.76%
Interest
0.00
0.00
Exceptional Items
0.00
2.28
-100.00%
Standalone Net Profit
1.71
-1.07
259.81%
Operating Profit Margin (Excl OI)
-101.23%
-71.84%
-29.39%
Values in Rs Cr.
Direction Arrows
Net Sales

YoY Growth in nine months ended Dec 2025 is -80.67% vs 5.01% in Dec 2024

Direction Arrows
Standalone Net Profit

YoY Growth in nine months ended Dec 2025 is 259.81% vs 60.81% in Dec 2024

Annual Results Snapshot (Standalone) - Mar'25stock-summary

Mar'25
Mar'24
Change(%)
Net Sales
4.27
4.84
-11.78%
Operating Profit (PBDIT) excl Other Income
-3.57
-3.13
-14.06%
Interest
0.00
0.03
-100.00%
Exceptional Items
2.28
2.61
-12.64%
Standalone Net Profit
-0.91
-1.90
52.11%
Operating Profit Margin (Excl OI)
-83.61%
-64.67%
-18.94%
Values in Rs Cr.
Direction Arrows
Net Sales

YoY Growth in year ended Mar 2025 is -11.78% vs -72.25% in Mar 2024

Direction Arrows
Standalone Net Profit

YoY Growth in year ended Mar 2025 is 52.11% vs 8.21% in Mar 2024

stock-summaryCompany CV
About Piccadily Sugar & Allied Inds Ltd stock-summary
stock-summary
Piccadily Sugar & Allied Inds Ltd
Micro Cap
Sugar
Incorporated in Mar.'93 in the assisted sector by the Punjab State Industrial Development Corporation, the Piccadily group, Vinod Kumar and others, Piccadily Sugar and Allied Industries (PSAIL) presently manufactures White Crystal Sugar from sugarcane cultivated and Rectified Spirit, Extra Natural Alcohol (ENA) from Molasses/ Rice / Wheat, Ethanol, IMFL, PML, Country Liquor, etc. The by-products are molasses, bagasse and power.
Company Coordinates stock-summary
Company Details
Jakhal Road, Patran Patiala Punjab : 147001
stock-summary
Tel: 91-01764-242501/242020
stock-summary
Piccadilygroup34@rediffmail.com
Registrar Details
Abhipra Capital Ltd , Abhipra Complex, A-387 Azadpur, Dilkush Indl.Area G T Karnal Road , New Delhi