
Compare Fiberweb (India) with Similar Stocks
Stock DNA
Garments & Apparels
INR 82 Cr (Micro Cap)
8.00
24
0.00%
0.00
5.45%
0.44
Total Returns (Price + Dividend) 
Latest dividend: 0.5 per share ex-dividend date: Sep-22-2020
Risk Adjusted Returns v/s
Returns Beta

News
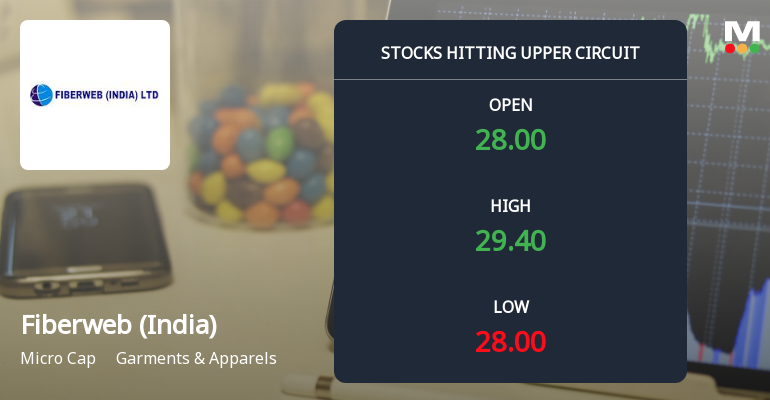
Fiberweb (India) Ltd Locks at Upper Circuit With 4.99% Gain — Buyers Queue, Sellers Absent
At Rs 29.23, the buying was done — not because demand dried up, but because the exchange wouldn't let the stock go any higher. Fiberweb (India) Ltd locked at its upper circuit of 4.99% on 15 Jun 2026, with buyers queuing and no sellers willing to part with shares.
Read full news article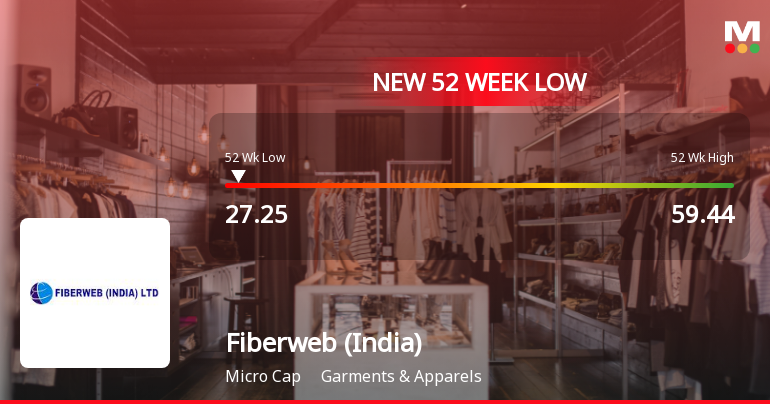
Markets Rally, But Fiberweb (India) Ltd Sinks to 52-Week Low in Stock-Specific Sell-Off
Despite broader market resilience, Fiberweb (India) Ltd has plunged to a fresh 52-week low of Rs 27.25 on 2 Jun 2026, marking a near 49% decline over the past year and underscoring persistent headwinds for this micro-cap garment and apparel player.
Read full news article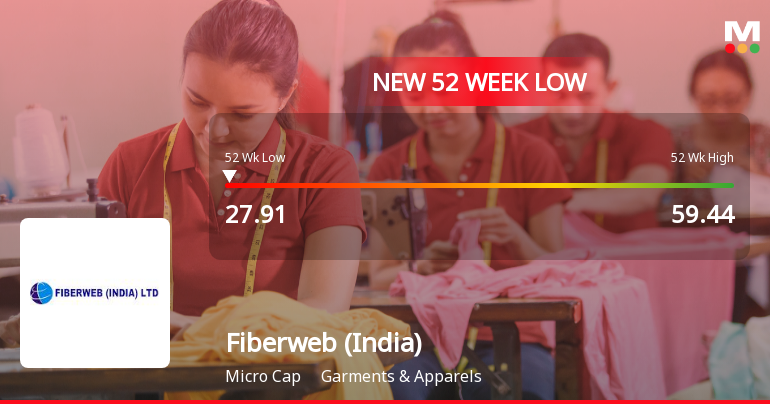
Announcements
Disclosures under Reg. 29(2) of SEBI (SAST) Regulations 2011
25-May-2026 | Source : BSEThe Exchange has received the disclosure under Regulation 29(2) of SEBI (Substantial Acquisition of Shares & Takeovers) Regulations 2011 for Pravin V Sheth
Disclosures under Reg. 29(2) of SEBI (SAST) Regulations 2011
25-May-2026 | Source : BSEThe Exchange has received the disclosure under Regulation 29(2) of SEBI (Substantial Acquisition of Shares & Takeovers) Regulations 2011 for Gayatri Pipes & Fittings Pvt Ltd
Announcement under Regulation 30 (LODR)-Newspaper Publication
16-May-2026 | Source : BSESubmission of Advertisement published in newspapers for Standalone Audited Financial Results for the 4th quarter and year ended 31st March 2026.
Corporate Actions

No Upcoming Board Meetings

Fiberweb (India) Ltd has declared 5% dividend, ex-date: 22 Sep 20

No Splits history available

Fiberweb (India) Ltd has announced 1:1 bonus issue, ex-date: 17 Jan 18

No Rights history available
Quality key factors
Valuation key factors
Technicals key factors
 Technical Indicator Scale: Bearish, Mildly Bearish, Sideways, Mildly Bullish, Bullish Turned
 Shareholding Snapshot : Mar 2026
Shareholding Compare (%holding)
Non Institution
None
Held by 9 Schemes (0.18%)
Held by 5 FIIs (0.17%)
Bhavesh Sheth (28.65%)
Dheeraj Kumar Lohia (3.58%)
48.51%
Quarterly Results Snapshot (Standalone) - Mar'26 - YoY

YoY Growth in quarter ended Mar 2026 is -63.68% vs 29.40% in Mar 2025
YoY Growth in quarter ended Mar 2026 is -130.34% vs 42.33% in Mar 2025
Half Yearly Results Snapshot (Standalone) - Sep'25

Growth in half year ended Sep 2025 is -0.34% vs -2.53% in Sep 2024
Growth in half year ended Sep 2025 is 18.17% vs 192.73% in Sep 2024
Nine Monthly Results Snapshot (Standalone) - Dec'25
YoY Growth in nine months ended Dec 2025 is 0.42% vs 14.10% in Dec 2024
YoY Growth in nine months ended Dec 2025 is 15.52% vs 167.11% in Dec 2024
Annual Results Snapshot (Standalone) - Mar'26
YoY Growth in year ended Mar 2026 is -16.52% vs 17.78% in Mar 2025
YoY Growth in year ended Mar 2026 is -33.27% vs 106.33% in Mar 2025
About Fiberweb (India) Ltd

Company Coordinates


