
Compare Jaipan Industrie with Similar Stocks
Dashboard
Weak Long Term Fundamental Strength with an average Return on Capital Employed (ROCE) of 3.49%
- Poor long term growth as Net Sales has grown by an annual rate of 13.55% and Operating profit at 5.87% over the last 5 years
- Low ability to service debt as the company has a high Debt to EBITDA ratio of 7.15 times
Flat results in Mar 26
Consistent Underperformance against the benchmark over the last 3 years
Stock DNA
Electronics & Appliances
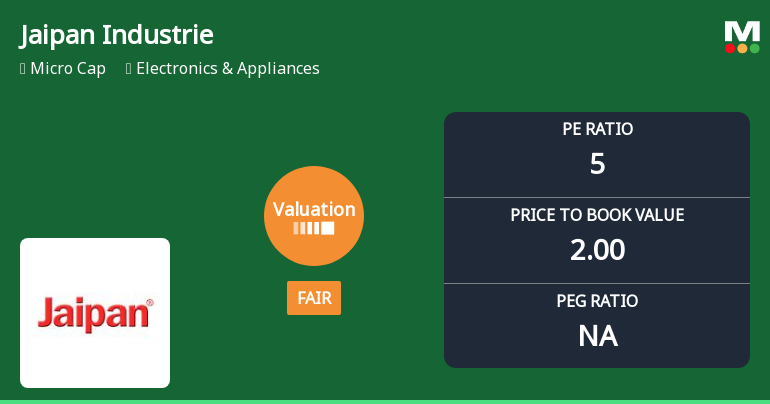
INR 17 Cr (Micro Cap)
5.00
23
0.00%
0.69
43.19%
2.20
Total Returns (Price + Dividend) 
Jaipan Industrie for the last several years.
Risk Adjusted Returns v/s
Returns Beta

News
Jaipan Industries Ltd Valuation Shifts Amid Mixed Market Performance
Jaipan Industries Ltd, a micro-cap player in the Electronics & Appliances sector, has witnessed a notable shift in its valuation parameters, moving from an attractive to a fair valuation grade. Despite a modest day gain of 2.30%, the company’s price-to-earnings (P/E) and price-to-book value (P/BV) ratios reflect a changing market perception, influenced by both internal performance metrics and broader sector dynamics.
Read full news articleAre Jaipan Industries Ltd latest results good or bad?
Jaipan Industries Ltd's latest financial results for Q4 FY26 reveal significant operational challenges. The company reported a net sales figure of ₹5.01 crores, which represents a quarter-on-quarter decline of 43.07% from ₹8.80 crores in Q3 FY26. This sharp contraction marks the weakest sales performance in the past seven quarters and indicates potential demand-side issues in the consumer durables market. Year-on-year, net sales also fell by 29.04% from ₹7.06 crores in Q4 FY25. In terms of profitability, Jaipan Industries recorded a net profit of ₹0.06 crores, down 45.45% from ₹0.11 crores in the previous quarter. Despite this decline, the operating margin improved to 5.19%, up from 2.61% in Q3 FY26, suggesting some degree of cost discipline amidst falling revenues. However, the profit after tax margin slightly compressed to 1.20% from 1.25% in the prior quarter, reflecting ongoing pressure on profitabilit...
Read full news article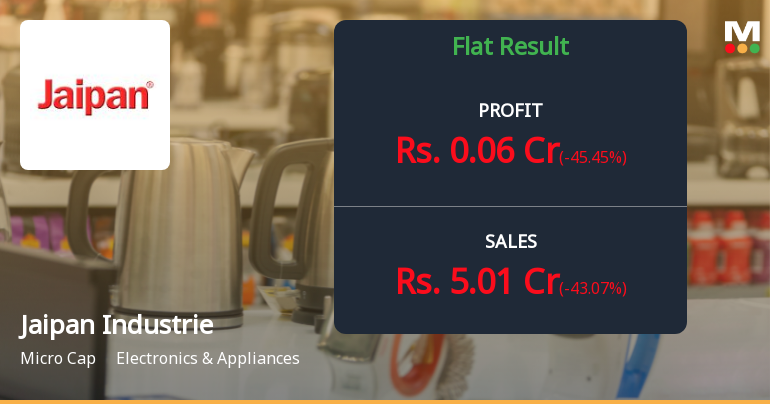
Jaipan Industries Q4 FY26: Sharp Revenue Decline Raises Concerns Despite Profitability
Jaipan Industries Ltd., a micro-cap player in the electronics and appliances sector, reported a concerning fourth quarter for FY26, with net sales plummeting 43.07% sequentially to ₹5.01 crores from ₹8.80 crores in Q3 FY26. Year-on-year, revenue declined 29.04% from ₹7.06 crores in Q4 FY25. Despite the revenue contraction, the company maintained profitability with net profit of ₹0.06 crores, down 45.45% quarter-on-quarter but flat year-on-year.
Read full news article Announcements
Outcome For The Meeting Of The Board Of Directors Of Jaipan Industries Limited (The Company) For The Year Ended 31St March 2026.
30-May-2026 | Source : BSEfor approval of audited Financial Result for the Financial Year ended 31st March2026
Compliances-Reg.24(A)-Annual Secretarial Compliance
27-May-2026 | Source : BSESubmission of Annual Secretarial compliance Report under Regulation 24A of SEBI(LODR)Regulations2015
Board Meeting Intimation for Intimation For The Meeting Of The Board Of Directors Of Jaipan Industries Limited (The Company) For The Year Ended 31St March 2026
22-May-2026 | Source : BSEJaipan Industries Ltdhas informed BSE that the meeting of the Board of Directors of the Company is scheduled on 30/05/2026 inter alia to consider and approve 1)Consider and Approve the Audited Financial Results along with Auditors Report of the Company for the year ended 31st March 2026 2)Any other matter with the permission of chair
Corporate Actions

No Upcoming Board Meetings

No Dividend history available

No Splits history available

No Bonus history available

No Rights history available
Quality key factors
Valuation key factors
Technicals key factors
 Technical Indicator Scale: Bearish, Mildly Bearish, Sideways, Mildly Bullish, Bullish Turned
 Shareholding Snapshot : Mar 2026
Shareholding Compare (%holding)
Non Institution
None
Held by 0 Schemes
Held by 0 FIIs
Jainarain O Agarwal (28.97%)
Parthiv Rameshchandra Patel (5%)
52.38%
Quarterly Results Snapshot (Standalone) - Mar'26 - QoQ

QoQ Growth in quarter ended Mar 2026 is -43.07% vs 18.28% in Dec 2025

QoQ Growth in quarter ended Mar 2026 is -45.45% vs -96.46% in Dec 2025
Half Yearly Results Snapshot (Standalone) - Sep'25
Growth in half year ended Sep 2025 is -1.96% vs 48.54% in Sep 2024
Growth in half year ended Sep 2025 is 2,533.33% vs 119.05% in Sep 2024
Nine Monthly Results Snapshot (Standalone) - Dec'25
YoY Growth in nine months ended Dec 2025 is 2.86% vs 42.63% in Dec 2024
YoY Growth in nine months ended Dec 2025 is 1,823.53% vs 117.17% in Dec 2024
Annual Results Snapshot (Standalone) - Mar'26
YoY Growth in year ended Mar 2026 is -4.98% vs 27.62% in Mar 2025
YoY Growth in year ended Mar 2026 is 1,287.50% vs 102.11% in Mar 2025
About Jaipan Industries Ltd

Company Coordinates


