
Compare Arman Financial with Similar Stocks
Dashboard
Strong Long Term Fundamental Strength with a 25.95% CAGR growth in Operating Profits
Healthy long term growth as Operating profit has grown by an annual rate of 25.95%
The company has declared Positive results for the last 3 consecutive quarters
With ROE of 6.1, it has a Very Expensive valuation with a 2.1 Price to Book Value
Despite the size of the company, domestic mutual funds hold only 0.75% of the company
Stock DNA
Non Banking Financial Company (NBFC)
INR 1,868 Cr (Micro Cap)
34.00
21
0.00%
1.90
6.06%
1.95
Total Returns (Price + Dividend) 
Latest dividend: 1.4 per share ex-dividend date: Sep-13-2019
Risk Adjusted Returns v/s
Returns Beta

News
Arman Financial Services Ltd is Rated Hold
Arman Financial Services Ltd is rated 'Hold' by MarketsMOJO, with this rating last updated on 06 May 2026. However, the analysis and financial metrics discussed here reflect the stock's current position as of 12 July 2026, providing investors with an up-to-date view of the company’s fundamentals, returns, and market standing.
Read full news article
Arman Financial Services Ltd is Rated Hold
Arman Financial Services Ltd is rated 'Hold' by MarketsMOJO, with this rating last updated on 06 May 2026. However, the analysis and financial metrics presented here reflect the stock's current position as of 01 July 2026, providing investors with an up-to-date view of the company’s performance and outlook.
Read full news article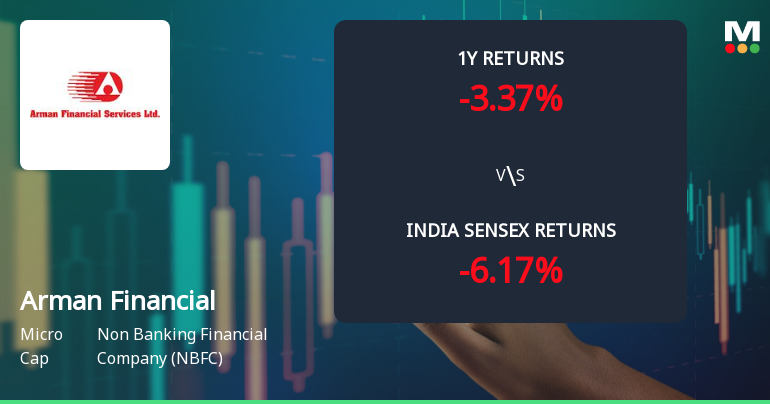
Arman Financial Services Ltd Shows Bullish Momentum Amid Technical Upgrades
Arman Financial Services Ltd has demonstrated a notable shift in price momentum, supported by a series of bullish technical indicators. The micro-cap NBFC stock has upgraded its MarketsMOJO grade from Sell to Hold, reflecting improved investor sentiment and technical strength amid a mixed broader market environment.
Read full news article Announcements
Compliances-Reg. 57 (1) - Certificate of interest payment/Principal in case of NCD
10-Jul-2026 | Source : BSECertificate of Interest Payment
Compliances-Certificate under Reg. 74 (5) of SEBI (DP) Regulations 2018
09-Jul-2026 | Source : BSECertificate under Regulation 74(5) of SEBI (DP) Regualtions 2018
Compliances-Reg. 57 (1) - Certificate of interest payment/Principal in case of NCD
03-Jul-2026 | Source : BSECertificate of Interest Payment
Corporate Actions

No Upcoming Board Meetings

Arman Financial Services Ltd has declared 14% dividend, ex-date: 13 Sep 19

No Splits history available

No Bonus history available

No Rights history available
Quality key factors
Valuation key factors
Technicals key factors
 Technical Indicator Scale: Bearish, Mildly Bearish, Sideways, Mildly Bullish, Bullish Turned
 Shareholding Snapshot : Mar 2026
Shareholding Compare (%holding)
Non Institution
None
Held by 2 Schemes (0.59%)
Held by 27 FIIs (2.61%)
Namra Holdings And Consultancy Services Llp (9.02%)
Elevation Capital V Limited (10.13%)
48.04%
Quarterly Results Snapshot (Consolidated) - Mar'26 - QoQ

QoQ Growth in quarter ended Mar 2026 is 9.69% vs 0.54% in Dec 2025

QoQ Growth in quarter ended Mar 2026 is 84.90% vs 177.60% in Dec 2025
Half Yearly Results Snapshot (Consolidated) - Sep'25
Growth in half year ended Sep 2025 is -15.22% vs 18.10% in Sep 2024
Growth in half year ended Sep 2025 is -114.15% vs -42.33% in Sep 2024
Nine Monthly Results Snapshot (Consolidated) - Dec'25
YoY Growth in nine months ended Dec 2025 is -11.38% vs 10.88% in Dec 2024
YoY Growth in nine months ended Dec 2025 is -60.34% vs -67.98% in Dec 2024
Annual Results Snapshot (Consolidated) - Mar'26
YoY Growth in year ended Mar 2026 is -11.53% vs 10.37% in Mar 2025
YoY Growth in year ended Mar 2026 is 8.72% vs -70.00% in Mar 2025
About Arman Financial Services Ltd

Company Coordinates


