Befound Movement

  • Market Cap: Micro Cap
  • Industry: Commercial Services & Supplies
  • ISIN: INE425F01028
  • NSEID:
  • BSEID: 511585
INR
3.94
-0.08 (-1.99%)
BSENSE

Feb 03

BSE+NSE Vol: 390

  • Price Points
  • Score
  • Mojo Parameters
  • Total Return
  • News and Corporate Actions
  • Key factors
  • Shareholding
  • Financials
  • CompanyCV
stock-recommendationUpcoming Result: Befound Movement will declare its result soon on 12 Feb 2026
stock-summaryPrice Point
High/Low

1Day

52 Week

Valuation
Technical
Day's Volume

CASH

390 (-10.80%) Volume

Shareholding (Dec 2025)

FII

2.81%

Held by 1 FIIs

DII

0.00%

Held by 0 DIIs

Promoter

0.00%

Who are in the management team of Befound Movement?

06-Jun-2025

As of March 2022, the management team of Befound Movement includes Ashok Gangar, Rohit Thorve, and Neha Badlani as Non-Executive Independent Directors, Adarsh Kapoor as Managing Director, Rajesh Kapoor as Director (Finance) & CFO, and Swarnlata Jain as Company Secretary & Compliance Officer.

As of March 2022, the management team of Befound Movement includes the following individuals:<BR><BR>1. Ashok Gangar - Non-Executive & Independent Director<BR>2. Rohit Thorve - Non-Executive & Independent Director<BR>3. Neha Badlani - Non-Executive & Independent Director<BR>4. Adarsh Kapoor - Managing Director<BR>5. Rajesh Kapoor - Director (Finance) & CFO<BR>6. Swarnlata Jain - Company Secretary & Compliance Officer<BR><BR>These individuals play key roles in the governance and management of the company.

View full answer

Has Befound Movement declared dividend?

06-Jun-2025

No Dividend History Available

Who are the peers of the Befound Movement?

03-Jun-2025

Peers of the Befound Movement include Firstsour.Solu., eClerx Services, RPSG Ventures, Hinduja Global, Alldigi Tech, Tracxn Technolo., and One Point One. In terms of performance, Firstsour.Solu. leads with a 1-year return of 96.58%, while Befound Movement has a 1-year return of 10.14%.

Peers: The peers of the Befound Movement are Firstsour.Solu., eClerx Services, RPSG Ventures, Hinduja Global, Alldigi Tech, Tracxn Technolo., and One Point One.<BR><BR>Quality Snapshot: Excellent management risk is observed at eClerx Services and Tracxn Technolo., while Good management risk is found at Firstsour.Solu. Average management risk is present at RPSG Ventures, Hinduja Global, and Alldigi Tech, while Below Average management risk is noted for Befound Movement and One Point One. In terms of Growth, Excellent growth is seen at RPSG Ventures, while Average growth is found at Firstsour.Solu. and eClerx Services, with Below Average growth at Hinduja Global, Alldigi Tech, Tracxn Technolo., Befound Movement, and One Point One. For Capital Structure, Excellent capital structure is noted at Alldigi Tech and Befound Movement, Good capital structure is found at Firstsour.Solu., Hinduja Global, and Tracxn Technolo., while Below Average capital structure is observed at RPSG Ventures and One Point One.<BR><BR>Return Snapshot: The peer with the highest 1-year return is Firstsour.Solu. at 96.58%, while the peer with the lowest 1-year return is Hinduja Global at -37.18%. Befound Movement's 1-year return of 10.14% is significantly lower than that of Firstsour.Solu. and higher than that of Hinduja Global. Additionally, RPSG Ventures, Hinduja Global, Alldigi Tech, Tracxn Technolo., and One Point One have negative six-month returns.

View full answer

What is the technical trend for Befound Movement?

09-Jun-2025

As of May 23, 2025, Befound Movement's trend is neutral with mixed signals, showing a sideways movement influenced by conflicting MACD and RSI indicators, while Bollinger Bands suggest potential upward movement.

As of 23 May 2025, the technical trend for Befound Movement has changed from mildly bearish to sideways. The current stance is neutral, with mixed signals across various indicators. The weekly MACD is bullish, while the monthly MACD is mildly bearish, indicating conflicting momentum. The weekly RSI is bearish, suggesting downward pressure, but the monthly RSI shows no signal, indicating a lack of strong directional movement. Bollinger Bands are mildly bullish on both weekly and monthly time frames, hinting at potential upward movement. Moving averages on the daily time frame are mildly bearish, which could weigh on short-term performance. Overall, the mixed indicators reflect a sideways trend with no clear strength in either bullish or bearish direction.

View full answer

What does Befound Movement do?

17-Jul-2025

Befound Movement Limited is a micro-cap company in the Commercial Services & Supplies industry, focused on trading and consultancy. As of March 2025, it reported net sales of 12 Cr and a net profit of 5 Cr, with a market cap of INR 3 Cr.

Overview:<BR>Befound Movement Limited operates in the Commercial Services & Supplies industry as a micro-cap company engaged in trading and consultancy.<BR><BR>History:<BR>The company was incorporated on September 2, 1988, originally known as Regency Investment Trust Corporation, and it adopted its current name on September 13, 1996. The latest quarterly results reported net sales and profit for the period ending March 2025.<BR><BR>Financial Snapshot:<BR>- Net Sales: 12 Cr (Quarterly Results - Mar 2025)<BR>- Net Profit: 5 Cr (Quarterly Results - Mar 2025)<BR>- Market cap: INR 3 Cr (Micro Cap)<BR><BR>Key Metrics:<BR>- P/E: 3.00<BR>- Industry P/E: 23<BR>- Dividend Yield: 0.00%<BR>- Debt Equity: -1.10<BR>- Return on Equity: -3.00%<BR>- Price to Book: -3.24<BR><BR>Contact Details:<BR>Address: 39 R B C Road Ground Floor, Near DumDum Central Jain Kolkata West Bengal : 700028<BR>Email: rtltd2011@gmail.com<BR>Website: http://www.regencytrust.in

View full answer

Who are the top shareholders of the Befound Movement?

17-Jul-2025

The top shareholders of Befound Movement are primarily individual investors, holding 72.81% of shares, with Naresh Nagindas Shah as the largest public shareholder at 6.02%. There is also one foreign institutional investor with a 2.81% stake, and no pledged promoter holdings or mutual fund investments.

The top shareholders of Befound Movement include individual investors, who hold a significant 72.81% of the company's shares. The highest public shareholder is Naresh Nagindas Shah, with a holding of 6.02%. Additionally, there is one foreign institutional investor (FII) that holds 2.81% of the shares. Notably, there are no pledged promoter holdings and no mutual funds currently invested in the company.

View full answer

How big is Befound Movement?

24-Jul-2025

As of 24th July, Befound Movement Limited has a market capitalization of 4.00 Cr, with recent net sales of 1.45 Cr and a net profit of 0.03 Cr. The company has negative shareholder's funds of -0.17 Cr and total assets of 1.04 Cr.

As of 24th July, Befound Movement Limited has a market capitalization of 4.00 Cr, categorized as a Micro Cap company.<BR><BR>In the latest four quarters, Befound Movement reported Net Sales of 1.45 Cr and a Net Profit of 0.03 Cr.<BR><BR>As of the latest annual period, the company has Shareholder's Funds of -0.17 Cr and Total Assets amounting to 1.04 Cr.

View full answer

Are Befound Movement latest results good or bad?

13-Aug-2025

Befound Movement's latest results show a positive turnaround in profitability and a significant increase in net sales, but overall performance is flat and market sentiment is negative, leading to a 'Sell' rating from MarketsMOJO. Therefore, the results are mixed and may not be perceived as entirely good.

Befound Movement's latest results present a mixed picture. On one hand, the company has shown significant improvement in key financial metrics, particularly in Profit After Tax (PAT), which has turned positive at Rs 0.45 crore for the latest six-month period, compared to a loss of Rs -0.46 crore in the previous twelve months. This indicates a strong turnaround in profitability.<BR><BR>Additionally, the company reported a remarkable 650% increase in net sales year-over-year for the quarter ending June 2025, which is a positive sign of growth. The standalone net profit also saw a 50% improvement compared to the same quarter last year.<BR><BR>However, despite these positive developments, the overall financial performance is described as flat, with a decline in the company's score from 7 to 3 over the past three months. Furthermore, the stock has been rated as a 'Sell' by MarketsMOJO, suggesting that market sentiment may not be favorable at this time.<BR><BR>In summary, while there are notable improvements in profitability and sales growth, the flat overall performance and negative market sentiment indicate that the results may not be perceived as entirely good.

View full answer

When is the next results date for Befound Movement?

07-Nov-2025

The next results date for Befound Movement is 13 November 2025.

The next results date for Befound Movement is scheduled for 13 November 2025.

View full answer

How has been the historical performance of Befound Movement?

14-Nov-2025

Befound Movement's historical performance shows fluctuating net sales, increasing to 1.45 Cr in Mar'25 from 1.23 Cr in Mar'24, but down from a peak of 1.66 Cr in Mar'22. The company has faced financial challenges, with negative reserves of -1.13 Cr in Mar'25 and stagnant cash flow activities.

Answer:<BR>The historical performance of Befound Movement shows fluctuating net sales and profitability over the years, with a notable increase in net sales from 1.23 Cr in Mar'24 to 1.45 Cr in Mar'25. However, this is a decline from the peak of 1.66 Cr in Mar'22. The total operating income followed a similar trend, peaking at 1.66 Cr in Mar'22 and then decreasing to 1.45 Cr in Mar'25. The company has faced challenges with total expenditure, which was 1.40 Cr in Mar'25, up from 1.16 Cr in Mar'24, but lower than the 1.76 Cr in Mar'23. Operating profit has been inconsistent, with a slight profit of 0.05 Cr in Mar'25 compared to a loss of 0.45 Cr in Mar'23. Profit after tax also showed a small profit of 0.03 Cr in Mar'25, a recovery from the loss of 0.46 Cr in Mar'23. The company's reserves have been negative, at -1.13 Cr in Mar'25, indicating ongoing financial challenges. The total liabilities increased to 1.41 Cr in Mar'25 from 1.04 Cr in Mar'24, while total assets rose to 1.41 Cr in Mar'25, reflecting a slight improvement in the asset base. Cash flow activities have remained stagnant, with no cash inflow or outflow reported over the years.<BR><BR>Breakdown:<BR>Befound Movement's net sales have shown a fluctuating pattern, increasing to 1.45 Cr in Mar'25 from 1.23 Cr in Mar'24, but down from 1.66 Cr in Mar'22. The total operating income mirrored this trend, reaching 1.45 Cr in Mar'25 after peaking at 1.66 Cr in Mar'22. Total expenditure rose to 1.40 Cr in Mar'25, up from 1.16 Cr in Mar'24, while operating profit improved slightly to 0.05 Cr in Mar'25 from a loss of 0.45 Cr in Mar'23. Profit after tax also showed a positive shift to 0.03 Cr in Mar'25, recovering from a significant loss of 0.46 Cr in Mar'23. The company's reserves remain negative at -1.13 Cr in Mar'25, indicating ongoing financial difficulties. Total liabilities increased to 1.41 Cr in Mar'25, while total assets also rose to 1.41 Cr, suggesting a slight improvement in the asset position. Despite these changes, cash flow activities have remained stagnant, with no cash movements reported across the years.

View full answer

Should I buy, sell or hold Befound Movement?

16-Nov-2025

Is Befound Movement overvalued or undervalued?

05-Dec-2025

As of December 4, 2025, Befound Movement is fairly valued with a PE ratio of 10.69 and strong performance, outperforming the Sensex, making it an attractive investment compared to its peers.

As of 4 December 2025, the valuation grade for Befound Movement has moved from risky to fair. The company is currently fairly valued based on its financial metrics. Key ratios include a PE ratio of 10.69, an EV to EBIT of 7.01, and a PEG ratio of 0.05, indicating a potentially attractive investment given the low growth expectations reflected in the PEG ratio.<BR><BR>In comparison to its peers, Befound Movement's PE ratio is significantly lower than Bajaj Finance, which is considered very expensive at a PE of 34.9, and slightly below Life Insurance, which is very attractive with a PE of 10.85. The company has shown strong performance with a year-to-date return of 35.57%, significantly outperforming the Sensex's 9.12% during the same period, reinforcing its valuation story.

View full answer

Why is Befound Movement Limited falling/rising?

01-Feb-2026

As of 01-Feb, Befound Movement Limited's stock price is at 4.10, reflecting a decline of -1.91% and a total drop of -19.13% over the last 12 days. The stock is underperforming compared to the Sensex and faces challenges such as negative book value and weak fundamentals, leading to a generally negative sentiment among investors.

As of 01-Feb, Befound Movement Limited's stock price is falling, currently at 4.10, which reflects a change of -0.08 or -1.91%. The stock has been on a downward trend, having lost value for the last 12 consecutive days, resulting in a total decline of -19.13% during this period. This sustained decrease is compounded by the fact that the stock is trading below its 5-day, 20-day, 50-day, 100-day, and 200-day moving averages, indicating a bearish trend.<BR><BR>In the broader context, the stock has underperformed compared to the Sensex, with a 1-week decline of -9.09% versus the Sensex's -1.00%, and a 1-month decline of -9.89% compared to the Sensex's -4.67%. Year-to-date, the stock is down -11.64%, while the Sensex has only fallen -5.28%. <BR><BR>Additionally, the company faces significant challenges, including a negative book value and weak long-term fundamental strength, which raises concerns about its growth potential. Despite a 14.85% return over the past year, the company's net sales growth has been modest at an annual rate of 20.40%, with operating profit stagnating at 0%. The liquidity of the stock is also a concern, although there has been a notable increase in delivery volume, rising by 1792.16% against the 5-day average, suggesting some investor interest. However, the overall sentiment remains negative due to the company's financial instability and poor long-term growth prospects.

View full answer

Which are the latest news on Befound Movement?

03-Feb-2026

iScoreScore
Click here to find our call on this stock
Strong Sell
Sell
Hold
Buy
Strong Buy

MarketsMojo — Loved in India, Now Global

The power of Mojo is now in 29 countries. Explore global equities with the same cutting-edge features you love.

Dashboard

1

With a Negative Book Value, the company has a Weak Long Term Fundamental Strength

  • Poor long term growth as Net Sales has grown by an annual rate of 20.40% and Operating profit at 0%
2

Flat results in Sep 25

3

Risky - Negative Book Value

stock-summaryMojo Parameters

Mojo Parameters

Loading Valuation Snapshot...

Stock DNA

stock-summary
Industry

Commercial Services & Supplies

stock-summary
Market cap

INR 4 Cr (Micro Cap)

stock-summary
P/E

8.00

stock-summary
Industry P/E

22

stock-summary
Dividend Yield

0.00%

stock-summary
Debt Equity

-1.56

stock-summary
Return on Equity

-51.00%

stock-summary
Price to Book

-4.02

Revenue and Profits:
Net Sales:
0 Cr
(Quarterly Results - Sep 2025)
Net Profit:
0 Cr
stock-summaryTotal Returns
Total Returns (Price + Dividend) stock-summary
Dividend Yield (0%)
TimePeriod
Price Return
Dividend Return
Total Return
3 Months
-6.19%
0%
-6.19%
6 Months
-4.14%
0%
-4.14%
1 Year
14.53%
0%
14.53%
2 Years
40.71%
0%
40.71%
3 Years
30.03%
0%
30.03%
4 Years
92.2%
0%
92.2%
5 Years
93.14%
0%
93.14%

Befound Movement for the last several years.

Risk Adjusted Returns v/s stock-summary
Returns Beta
Icon
Beta has not been calculated since enough price history is not available
stock-summaryNews & Corporate Actions

News

Why is Befound Movement Limited falling/rising?

Prolonged Downtrend and Underperformance

Befound Movement Limited has been experiencing a notable decline in its share price over recent weeks. The stock has fallen by 10.86% in the past week, sharply contrasting with the Sensex’s modest gain of 0.16% during the same period. Over the last month, the stock’s decline has deepened to 16.25%, significantly underperforming the Sensex’s 4.78% drop. Year-to-date, Befound Movement’s shares have lost 13.36%, while the benchmark index has declined by 4.17%. This persistent underperformance highlights the stock’s vulnerability amid broader market fluctuations.

Technical Indicators Signal Weak Momentum

The technical outlook for Befound Movement remains bearish. The stock is trading below all key moving aver...

Read full news article
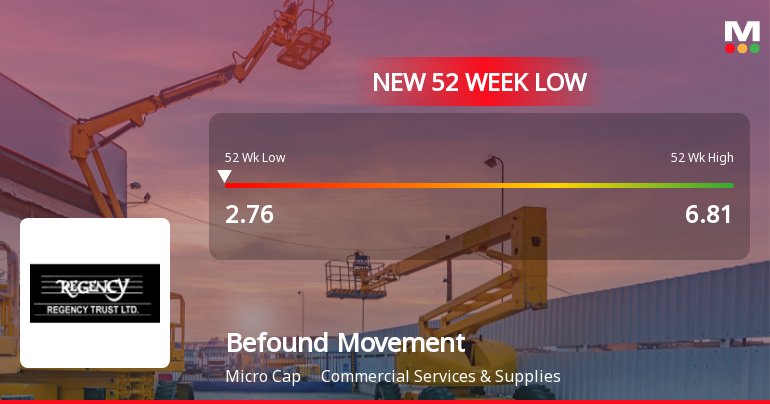
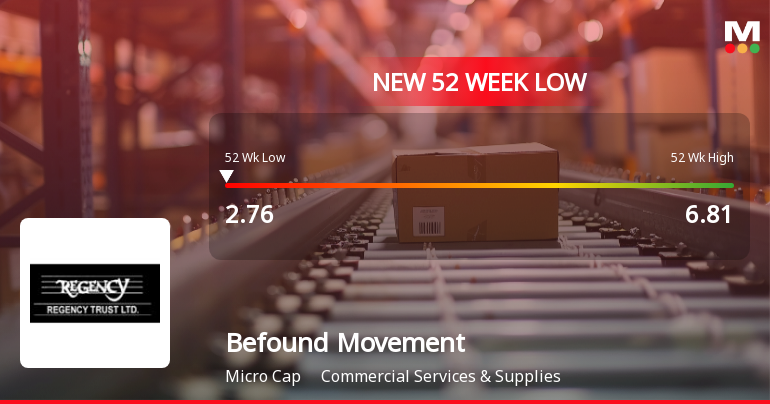
Announcements stock-summary

Compliances-Certificate under Reg. 74 (5) of SEBI (DP) Regulations 2018

14-Jan-2026 | Source : BSE

Compliance certificate under regulation 74 of SEBI (DP) Regulation for the quarter ended December 31 2025

Closure of Trading Window

27-Dec-2025 | Source : BSE

Closure of trading window

Shareholder Meeting / Postal Ballot-Outcome of Postal_Ballot

18-Dec-2025 | Source : BSE

Outcome of Postal Ballot

Corporate Actions stock-summary

stock-summary
BOARD MEETING

12 Feb 2026

stock-summary
DIVIDEND

No Dividend history available

stock-summary
SPLITS

No Splits history available

stock-summary
BONUS

No Bonus history available

stock-summary
RIGHTS

No Rights history available

stock-summaryKey Factors

Quality key factors stock-summary

Factor
Value
Sales Growth (5y)
20.40%
EBIT Growth (5y)
8.59%
Net Debt to Equity (avg)
-1.56
Institutional Holding
2.81%
ROE (avg)
0

Valuation key factors

Factor
Value
P/E Ratio
8
Industry P/E
22
Price to Book Value
-3.94
EV to EBIT
5.50
EV to EBITDA
5.50
EV to Capital Employed
3.67
EV to Sales
2.20
PEG Ratio
0.03
Dividend Yield
NA
ROCE (Latest)
33.33%
ROE (Latest)
Negative BV

Technicals key factors

Indicator
Weekly
Monthly
MACD
Bearish
Bullish
RSI
No Signal
No Signal
Bollinger Bands
Bearish
Bearish
Moving Averages
Mildly Bullish (Daily)
KST
Bearish
Bullish
Dow Theory
Mildly Bearish
Mildly Bearish
stock-summary Technical Indicator Scale: Bearish, Mildly Bearish, Sideways, Mildly Bullish, Bullish  Turned 
stock-summaryShareholding
Shareholding Snapshot : Dec 2025stock-summary
Shareholding Compare (%holding) stock-summary
Majority shareholders

Non Institution

Pledged Promoter Holdings

None

Mutual Funds

Held by 0 Schemes

FIIs

Held by 1 FIIs (2.81%)

Promoter with highest holding

None

Highest Public shareholder

Naresh Nagindas Shah (5.69%)

Individual Investors Holdings

73.1%

stock-summaryFinancial
[
  {
    "link": "quarterly",
    "btn_text": "All Quarterly Results",
    "header": "Quarterly Results Snapshot (Standalone) - Sep'25 - YoY",
    "rhs": [
      {
        "prefix": "Net Sales ",
        "suffix": "YoY Growth in quarter ended Sep 2025 is 800.00% vs -82.76% in Sep 2024",
        "dir": 1
      },
      {
        "prefix": "Standalone Net Profit ",
        "suffix": "YoY Growth in quarter ended Sep 2025 is 150.00% vs -411.11% in Sep 2024",
        "dir": 1
      }
    ],
    "table": {
      "header": [
        "Sep'25",
        "Sep'24",
        "Change(%)"
      ],
      "body": [
        {
          "field": "Net Sales",
          "val1": "0.45",
          "val2": "0.05",
          "chgp": "800.00%",
          "chgp_class": "positive"
        },
        {
          "field": "Operating Profit (PBDIT) excl Other Income",
          "val1": "0.15",
          "val2": "-0.26",
          "chgp": "157.69%",
          "chgp_class": "positive"
        },
        {
          "field": "Interest",
          "val1": "0.00",
          "val2": "0.00",
          "chgp": "",
          "chgp_class": "neutral"
        },
        {
          "field": "Exceptional Items",
          "val1": "0.00",
          "val2": "0.00",
          "chgp": "",
          "chgp_class": "neutral"
        },
        {
          "field": "Standalone Net Profit",
          "val1": "0.14",
          "val2": "-0.28",
          "chgp": "150.00%",
          "chgp_class": "positive"
        },
        {
          "field": "Operating Profit Margin (Excl OI)",
          "val1": "33.33%",
          "val2": "-520.00%",
          "chgp": "553.33%",
          "chgp_class": "positive"
        }
      ]
    }
  },
  {
    "link": "half-yearly",
    "btn_text": "All Half Yearly Results",
    "header": "Half Yearly Results Snapshot (Standalone) - Sep'25",
    "rhs": [
      {
        "prefix": "Net Sales ",
        "suffix": " Growth in half year ended Sep 2025 is 700.00% vs -69.39% in Sep 2024",
        "dir": 1
      },
      {
        "prefix": "Standalone Net Profit ",
        "suffix": " Growth in half year ended Sep 2025 is 117.50% vs -1,433.33% in Sep 2024",
        "dir": 1
      }
    ],
    "table": {
      "header": [
        "Sep'25",
        "Sep'24",
        "Change(%)"
      ],
      "body": [
        {
          "field": "Net Sales",
          "val1": "1.20",
          "val2": "0.15",
          "chgp": "700.00%",
          "chgp_class": "positive"
        },
        {
          "field": "Operating Profit (PBDIT) excl Other Income",
          "val1": "0.10",
          "val2": "-0.37",
          "chgp": "127.03%",
          "chgp_class": "positive"
        },
        {
          "field": "Interest",
          "val1": "0.00",
          "val2": "0.00",
          "chgp": "",
          "chgp_class": "neutral"
        },
        {
          "field": "Exceptional Items",
          "val1": "0.00",
          "val2": "0.00",
          "chgp": "",
          "chgp_class": "neutral"
        },
        {
          "field": "Standalone Net Profit",
          "val1": "0.07",
          "val2": "-0.40",
          "chgp": "117.50%",
          "chgp_class": "positive"
        },
        {
          "field": "Operating Profit Margin (Excl OI)",
          "val1": "8.33%",
          "val2": "-246.67%",
          "chgp": "255.00%",
          "chgp_class": "positive"
        }
      ]
    }
  },
  {
    "link": "nine-monthly",
    "btn_text": "All Nine Monthly Results",
    "header": "Nine Monthly Results Snapshot (Standalone) - Dec'24",
    "rhs": [
      {
        "prefix": "Net Sales ",
        "suffix": "YoY Growth in nine months ended Dec 2024 is -69.70% vs -38.89% in Dec 2023",
        "dir": -1
      },
      {
        "prefix": "Standalone Net Profit ",
        "suffix": "YoY Growth in nine months ended Dec 2024 is -2,500.00% vs 0.00% in Dec 2023",
        "dir": -1
      }
    ],
    "table": {
      "header": [
        "Dec'24",
        "Dec'23",
        "Change(%)"
      ],
      "body": [
        {
          "field": "Net Sales",
          "val1": "0.20",
          "val2": "0.66",
          "chgp": "-69.70%",
          "chgp_class": "negative"
        },
        {
          "field": "Operating Profit (PBDIT) excl Other Income",
          "val1": "-0.45",
          "val2": "0.03",
          "chgp": "-1,600.00%",
          "chgp_class": "negative"
        },
        {
          "field": "Interest",
          "val1": "0.00",
          "val2": "0.00",
          "chgp": "",
          "chgp_class": "neutral"
        },
        {
          "field": "Exceptional Items",
          "val1": "0.00",
          "val2": "0.00",
          "chgp": "",
          "chgp_class": "neutral"
        },
        {
          "field": "Standalone Net Profit",
          "val1": "-0.48",
          "val2": "0.02",
          "chgp": "-2,500.00%",
          "chgp_class": "negative"
        },
        {
          "field": "Operating Profit Margin (Excl OI)",
          "val1": "-225.00%",
          "val2": "4.55%",
          "chgp": "-229.55%",
          "chgp_class": "negative"
        }
      ]
    }
  },
  {
    "link": "annual",
    "btn_text": "All Annual Results",
    "header": "Annual Results Snapshot (Standalone) - Mar'25",
    "rhs": [
      {
        "prefix": "Net Sales ",
        "suffix": "YoY Growth in year ended Mar 2025 is 17.89% vs -6.11% in Mar 2024",
        "dir": 1
      },
      {
        "prefix": "Standalone Net Profit ",
        "suffix": "YoY Growth in year ended Mar 2025 is -25.00% vs 108.70% in Mar 2024",
        "dir": -1
      }
    ],
    "table": {
      "header": [
        "Mar'25",
        "Mar'24",
        "Change(%)"
      ],
      "body": [
        {
          "field": "Net Sales",
          "val1": "1.45",
          "val2": "1.23",
          "chgp": "17.89%",
          "chgp_class": "positive"
        },
        {
          "field": "Operating Profit (PBDIT) excl Other Income",
          "val1": "0.05",
          "val2": "0.07",
          "chgp": "-28.57%",
          "chgp_class": "negative"
        },
        {
          "field": "Interest",
          "val1": "0.00",
          "val2": "0.00",
          "chgp": "",
          "chgp_class": "neutral"
        },
        {
          "field": "Exceptional Items",
          "val1": "0.00",
          "val2": "0.00",
          "chgp": "",
          "chgp_class": "neutral"
        },
        {
          "field": "Standalone Net Profit",
          "val1": "0.03",
          "val2": "0.04",
          "chgp": "-25.00%",
          "chgp_class": "negative"
        },
        {
          "field": "Operating Profit Margin (Excl OI)",
          "val1": "3.45%",
          "val2": "5.69%",
          "chgp": "-2.24%",
          "chgp_class": "negative"
        }
      ]
    }
  }
]

Quarterly Results Snapshot (Standalone) - Sep'25 - YoYstock-summary

Sep'25
Sep'24
Change(%)
Net Sales
0.45
0.05
800.00%
Operating Profit (PBDIT) excl Other Income
0.15
-0.26
157.69%
Interest
0.00
0.00
Exceptional Items
0.00
0.00
Standalone Net Profit
0.14
-0.28
150.00%
Operating Profit Margin (Excl OI)
33.33%
-520.00%
553.33%
Values in Rs Cr.
Direction Arrows
Net Sales

YoY Growth in quarter ended Sep 2025 is 800.00% vs -82.76% in Sep 2024

Direction Arrows
Standalone Net Profit

YoY Growth in quarter ended Sep 2025 is 150.00% vs -411.11% in Sep 2024

Half Yearly Results Snapshot (Standalone) - Sep'25stock-summary

Sep'25
Sep'24
Change(%)
Net Sales
1.20
0.15
700.00%
Operating Profit (PBDIT) excl Other Income
0.10
-0.37
127.03%
Interest
0.00
0.00
Exceptional Items
0.00
0.00
Standalone Net Profit
0.07
-0.40
117.50%
Operating Profit Margin (Excl OI)
8.33%
-246.67%
255.00%
Values in Rs Cr.
Direction Arrows
Net Sales

Growth in half year ended Sep 2025 is 700.00% vs -69.39% in Sep 2024

Direction Arrows
Standalone Net Profit

Growth in half year ended Sep 2025 is 117.50% vs -1,433.33% in Sep 2024

Nine Monthly Results Snapshot (Standalone) - Dec'24stock-summary

Dec'24
Dec'23
Change(%)
Net Sales
0.20
0.66
-69.70%
Operating Profit (PBDIT) excl Other Income
-0.45
0.03
-1,600.00%
Interest
0.00
0.00
Exceptional Items
0.00
0.00
Standalone Net Profit
-0.48
0.02
-2,500.00%
Operating Profit Margin (Excl OI)
-225.00%
4.55%
-229.55%
Values in Rs Cr.
Direction Arrows
Net Sales

YoY Growth in nine months ended Dec 2024 is -69.70% vs -38.89% in Dec 2023

Direction Arrows
Standalone Net Profit

YoY Growth in nine months ended Dec 2024 is -2,500.00% vs 0.00% in Dec 2023

Annual Results Snapshot (Standalone) - Mar'25stock-summary

Mar'25
Mar'24
Change(%)
Net Sales
1.45
1.23
17.89%
Operating Profit (PBDIT) excl Other Income
0.05
0.07
-28.57%
Interest
0.00
0.00
Exceptional Items
0.00
0.00
Standalone Net Profit
0.03
0.04
-25.00%
Operating Profit Margin (Excl OI)
3.45%
5.69%
-2.24%
Values in Rs Cr.
Direction Arrows
Net Sales

YoY Growth in year ended Mar 2025 is 17.89% vs -6.11% in Mar 2024

Direction Arrows
Standalone Net Profit

YoY Growth in year ended Mar 2025 is -25.00% vs 108.70% in Mar 2024

stock-summaryCompany CV
About Befound Movement Limited stock-summary
stock-summary
Befound Movement Limited
Micro Cap
Commercial Services & Supplies
Befound Movement Limited, initially known as Regency Trust Limited was incorporated on September 02, 1988. The name of the Company was changed from Regency Trust Limited to Befound Movement Limited via ROC Certificate on April 09, 2024. It is a Non-Banking Finance Company registered with the Reserve Bank of India, which does not accept deposits from the public. The Company is into the business of trading and consultancy.
Company Coordinates stock-summary
Company Details
39 R B C Road Ground Floor, Near DumDum Central Jain Kolkata West Bengal : 700028
stock-summary
Tel:
stock-summary
rtltd2011@gmail.com
Registrar Details
Purva Shareregistry (India) Pvt Ltd , Gala No 9, Shiv Shakti, Industrial Estate,Sitaram Mill Comp., J R Boricha Marg, Lower Parel [E], Mumbai