
Compare B C C Fuba India with Similar Stocks
Dashboard
Strong ability to service debt as the company has a low Debt to EBITDA ratio of 1.49 times
Healthy long term growth as Operating profit has grown by an annual rate 56.67%
With a growth in Net Profit of 66.67%, the company declared Very Positive results in Mar 26
Majority shareholders : Non Institution
Consistent Returns over the last 3 years
Total Returns (Price + Dividend) 
B C C Fuba India for the last several years.
Risk Adjusted Returns v/s
Returns Beta

News
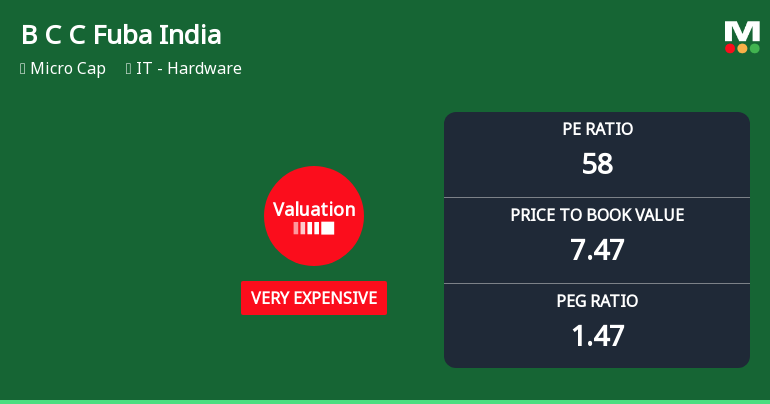
B C C Fuba India Ltd Valuation Shifts Amid Strong Market Performance
B C C Fuba India Ltd, a micro-cap player in the IT - Hardware sector, has seen a notable shift in its valuation parameters, moving from an expensive to a very expensive rating. Despite strong returns relative to the Sensex, the company’s elevated price-to-earnings and price-to-book ratios raise questions about its current price attractiveness and sustainability of growth expectations.
Read full news article
B C C Fuba India Ltd Upgraded to Buy on Strong Technical and Financial Performance
B C C Fuba India Ltd, a micro-cap player in the IT - Hardware sector, has seen its investment rating upgraded from Hold to Buy as of 23 June 2026. This upgrade follows a comprehensive reassessment across four key parameters: Quality, Valuation, Financial Trend, and Technicals. The company’s robust quarterly results, impressive long-term returns, and improving technical indicators have collectively driven this positive revision.
Read full news article
B C C Fuba India Ltd Upgraded to Hold on Technical and Financial Strength
B C C Fuba India Ltd, a micro-cap player in the IT - Hardware sector, has seen its investment rating upgraded from Sell to Hold as of 12 June 2026. This change reflects a marked improvement in the company’s technical indicators, robust financial performance, and a more balanced valuation outlook, signalling cautious optimism among investors despite recent price volatility.
Read full news article Announcements
Update On Conversion Of Partly Paid-Up Equity Shares Into Fully Paid-Up Equity Shares Upon Receipt Of First And Final Call
25-Jun-2026 | Source : BSEThis is in furtherance to our earlier announcement dated June 12 2026 regarding approval of Board of Directors for conversion of 4432220 partly paid up equity shares of face value of Rs. 10 each(paid up value of Rs. 5 per share) into fully paid up equity shares of face value of Rs. 10 each upon receipt of First and Final call money by the Company. We wish to inform you that the Company has completed the necessary corporate actions for credit of 4432220 fully paid up equity shares to demat accounts of eligible shareholders. The Company has also received listing and trading approvals from BSE limited(Stock Exchange). Accordingly the aforesaid 4432220 fully paid up equity shares shall be available for trading on the Stock Exchange with effect from June 29 2026 under ISIN: INE788D01016
Closure of Trading Window
23-Jun-2026 | Source : BSEIntimation for closure of trading window for the quarter ended 30th June 2026.
Disclosures under Reg. 29(1) of SEBI (SAST) Regulations 2011
17-Jun-2026 | Source : BSEThe Exchange has received the disclosure under Regulation 29(1) of SEBI (Substantial Acquisition of Shares & Takeovers) Regulations 2011 for Alka Gupta & Others
Corporate Actions

No Upcoming Board Meetings

No Dividend history available

No Splits history available

No Bonus history available

B C C Fuba India Ltd has announced 3:10 rights issue, ex-date: 11 Mar 26
Quality key factors
Valuation key factors
Technicals key factors
 Technical Indicator Scale: Bearish, Mildly Bearish, Sideways, Mildly Bullish, Bullish Turned
 Shareholding Snapshot : Jun 2026
Shareholding Compare (%holding)
Non Institution
1.5537
Held by 3 Schemes (0.14%)
Held by 0 FIIs
Manju Bhardwaj (8.18%)
Dipti Gupta (7.29%)
55.12%
Quarterly Results Snapshot (Standalone) - Mar'26 - QoQ

QoQ Growth in quarter ended Mar 2026 is 31.81% vs 1.65% in Dec 2025
QoQ Growth in quarter ended Mar 2026 is 66.67% vs -19.31% in Dec 2025
Half Yearly Results Snapshot (Standalone) - Sep'25
Growth in half year ended Sep 2025 is 55.18% vs 13.86% in Sep 2024
Growth in half year ended Sep 2025 is 54.75% vs -17.89% in Sep 2024
Nine Monthly Results Snapshot (Standalone) - Dec'25
YoY Growth in nine months ended Dec 2025 is 44.98% vs 39.86% in Dec 2024
YoY Growth in nine months ended Dec 2025 is 41.73% vs 5.30% in Dec 2024
Annual Results Snapshot (Standalone) - Mar'26
YoY Growth in year ended Mar 2026 is 54.22% vs 45.91% in Mar 2025
YoY Growth in year ended Mar 2026 is 57.22% vs -0.53% in Mar 2025
About B C C Fuba India Ltd

Company Coordinates


