
Compare KMC Speciality with Similar Stocks
Dashboard
Strong ability to service debt as the company has a low Debt to EBITDA ratio of 0.95 times
Healthy long term growth as Operating profit has grown by an annual rate 31.16%
With a growth in Operating Profit of 7.34%, the company declared Outstanding results in Mar 26
Market Beating performance in long term as well as near term
Total Returns (Price + Dividend) 
KMC Speciality for the last several years.
Risk Adjusted Returns v/s
Returns Beta

News
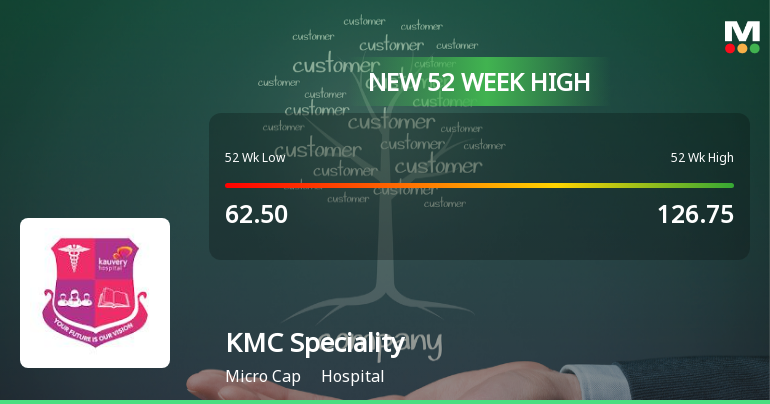
Broad-Based Technical Strength Lifts KMC Speciality Hospitals (India) Ltd to 52-Week High of Rs 127.8
With a surge to Rs 127.8 on 25 Jun 2026, KMC Speciality Hospitals (India) Ltd has reached a new 52-week and all-time high, marking a remarkable 94.03% gain over the past year. This milestone comes amid a backdrop of strong technical momentum and sustained earnings growth, positioning the stock well above its 52-week low of Rs 62.5.
Read full news article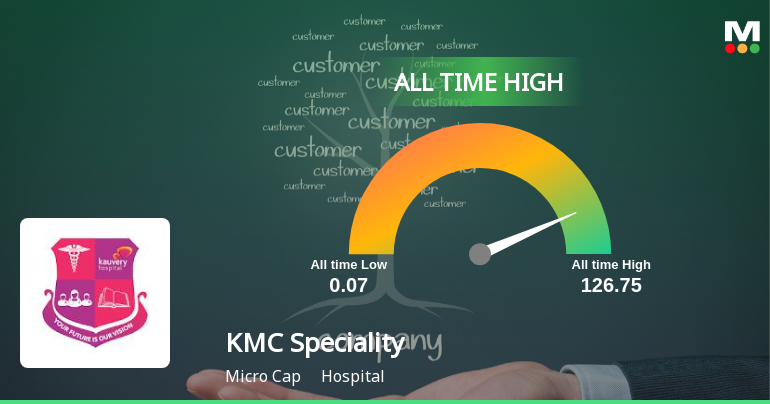
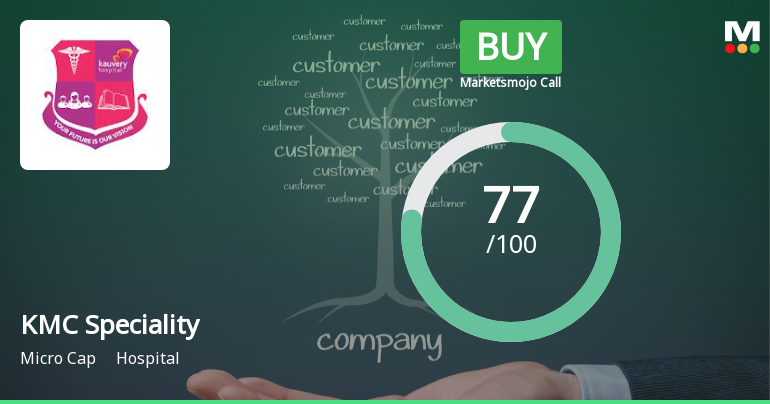
KMC Speciality Hospitals Downgraded to 'Buy' Amid Expensive Valuation and Strong Financials
KMC Speciality Hospitals (India) Ltd has seen its investment rating downgraded from Strong Buy to Buy as of 15 June 2026, primarily driven by a shift in valuation metrics despite robust financial performance and solid technical indicators. The company’s quality parameters remain strong, but an expensive valuation grade has prompted a reassessment of its overall investment appeal.
Read full news article Announcements
Announcement under Regulation 30 (LODR)-Newspaper Publication
19-Jun-2026 | Source : BSENewspaper publication regarding Special Window for transfer and dematerialisation of physical shares of the Company
Announcement under Regulation 30 (LODR)-Investor Presentation
05-Jun-2026 | Source : BSEInvestor Presentation for the quarter and year ended 31st March 2026
Compliances-Reg.24(A)-Annual Secretarial Compliance
29-May-2026 | Source : BSEPursuant to Regulation 24A of SEBI (LODR) Regulations 2015 please find enclosed the Annual Secretarial Compliance Report of the Company for the financial year ended March 31 2026 duly certified by the Practicing Company Secretary.
Corporate Actions

No Upcoming Board Meetings

No Dividend history available

No Splits history available

No Bonus history available

KMC Speciality Hospitals (India) Ltd has announced 12:1 rights issue, ex-date: 06 Jan 11
Quality key factors
Valuation key factors
Technicals key factors
 Technical Indicator Scale: Bearish, Mildly Bearish, Sideways, Mildly Bullish, Bullish Turned
 Shareholding Snapshot : Mar 2026
Shareholding Compare (%holding)
Promoters
None
Held by 4 Schemes (0.0%)
Held by 1 FIIs (0.0%)
Sri Kauvery Medical Care (india)limited (75.0%)
D Chitra (1.36%)
22.02%
Quarterly Results Snapshot (Standalone) - Mar'26 - QoQ

QoQ Growth in quarter ended Mar 2026 is 0.23% vs 9.56% in Dec 2025
QoQ Growth in quarter ended Mar 2026 is 6.55% vs 26.66% in Dec 2025
Half Yearly Results Snapshot (Standalone) - Sep'25
Growth in half year ended Sep 2025 is 29.41% vs 31.43% in Sep 2024

Growth in half year ended Sep 2025 is 95.74% vs -32.01% in Sep 2024
Nine Monthly Results Snapshot (Standalone) - Dec'25
YoY Growth in nine months ended Dec 2025 is 30.97% vs 29.01% in Dec 2024
YoY Growth in nine months ended Dec 2025 is 90.00% vs -27.47% in Dec 2024
Annual Results Snapshot (Standalone) - Mar'26
YoY Growth in year ended Mar 2026 is 32.03% vs 30.71% in Mar 2025
YoY Growth in year ended Mar 2026 is 118.06% vs -29.46% in Mar 2025
About KMC Speciality Hospitals (India) Ltd

Company Coordinates


