Beryl Drugs

  • Market Cap: Micro Cap
  • Industry: Pharmaceuticals & Biotechnology
  • ISIN: INE415H01017
  • NSEID:
  • BSEID: 524606
INR
21.94
-0.56 (-2.49%)
BSENSE

Feb 02

BSE+NSE Vol: 805

  • Price Points
  • Score
  • Mojo Parameters
  • Total Return
  • News and Corporate Actions
  • Key factors
  • Shareholding
  • Financials
  • CompanyCV
stock-recommendationUpcoming Result: Beryl Drugs will declare its result soon on 09 Feb 2026
stock-summaryPrice Point
High/Low

1Day

52 Week

Valuation
Technical
Day's Volume

CASH

805 (-49.88%) Volume

Shareholding (Dec 2025)

FII

0.00%

Held by 0 FIIs

DII

0.00%

Held by 0 DIIs

Promoter

26.38%

Who are in the management team of Beryl Drugs?

06-Jun-2025

As of March 2023, the management team of Beryl Drugs includes Sanjay Sethi (Managing Director), Sudhir Sethi (Chairman), Abhinav Naik, and Shreya Saraf (both Independent Directors). Sanjay Sethi earns Rs. 21.0 lacs, while the other directors receive Rs. 40.0 k each, and Sudhir Sethi does not receive any remuneration.

As of March 2023, the management team of Beryl Drugs includes:<BR><BR>1. Sanjay Sethi - Executive Director / Managing Director / Promoter<BR>2. Sudhir Sethi - Chairman & Non-Executive Director<BR>3. Abhinav Naik - Independent Non-Executive Director<BR>4. Shreya Saraf - Independent Non-Executive Director<BR><BR>Sanjay Sethi is the only member with a specified remuneration of Rs. 21.0 lacs, while Sudhir Sethi does not receive any remuneration. Both Abhinav Naik and Shreya Saraf receive Rs. 40.0 k each.

View full answer

Has Beryl Drugs declared dividend?

06-Jun-2025

No Dividend History Available

Who are the peers of the Beryl Drugs?

03-Jun-2025

Beryl Drugs' peers include Sun Pharma, Divi's Lab, Cipla, Torrent Pharma, Dr Reddy's Labs, Ortin Global, Adline Chem Lab, Ganga Pharma, and Fabino Enter. Beryl Drugs has below-average management risk, growth, and capital structure compared to its peers, with a 1-year return of -38.52%.

Peers: The peers of Beryl Drugs are Sun Pharma.Inds., Divi's Lab., Cipla, Torrent Pharma, Dr Reddy's Labs, Ortin Global, Adline Chem Lab, Ganga Pharma., and Fabino Enter.<BR><BR>Quality Snapshot: Excellent management risk is observed at Sun Pharma.Inds., Cipla, and Dr Reddy's Labs, while Good management risk is found at Divi's Lab., Torrent Pharma, and the rest. Below Average management risk is noted at Ortin Global, Ganga Pharma., Fabino Enter, and Beryl Drugs. Growth is Excellent at Sun Pharma.Inds., Cipla, and Dr Reddy's Labs, while Below Average growth is seen at Divi's Lab., Torrent Pharma, Ortin Global, Ganga Pharma., Fabino Enter, and Beryl Drugs. Excellent capital structure is present at Sun Pharma.Inds., Divi's Lab., Cipla, and Dr Reddy's Labs, while Good capital structure is found at Torrent Pharma, Average at Fabino Enter, and Below Average at Ortin Global, Adline Chem Lab, Ganga Pharma., and Beryl Drugs.<BR><BR>Return Snapshot: Divi's Lab. has the highest 1-year return at 51.69%, while Ortin Global has the lowest at -36.55%. Beryl Drugs' 1-year return of -38.52% is lower than both. Additionally, Ortin Global, Adline Chem Lab, Beryl Drugs, Ganga Pharma., and Fabino Enter all have negative six-month returns.

View full answer

What is the technical trend for Beryl Drugs?

09-Jun-2025

As of February 21, 2025, Beryl Drugs is in a bearish trend with moderate strength, indicated by bearish MACD, moving averages, and KST, alongside mildly bearish Bollinger Bands and Dow Theory signals.

As of 21 February 2025, the technical trend for Beryl Drugs has changed from mildly bearish to bearish. The current stance is bearish with a moderate strength. Key indicators driving this assessment include a bearish MACD on the weekly chart, bearish moving averages on the daily timeframe, and a bearish KST on the weekly. Additionally, Bollinger Bands are indicating a mildly bearish trend on both weekly and monthly charts. The Dow Theory shows a mildly bearish stance on the weekly but no trend on the monthly, further supporting the bearish outlook.

View full answer

What does Beryl Drugs do?

17-Jul-2025

Beryl Drugs Ltd manufactures, sells, and exports branded and generic pharmaceuticals, classified as a Micro Cap company with a market cap of INR 11 Cr. As of March 2025, it reported net sales of 40 Cr and a net profit of 2 Cr.

Overview:<BR>Beryl Drugs Ltd is engaged in the manufacture, sale, and export of branded and generic pharmaceutical formulations, operating within the Pharmaceuticals & Biotechnology industry and classified as a Micro Cap company.<BR><BR>History:<BR>Beryl Drugs Ltd was incorporated on August 24, 1993, and acquired the running business of M/s Flora and Fauna Remedies Limited on December 15, 1993. The latest quarterly results reported net sales and profit for March 2025.<BR><BR>Financial Snapshot:<BR>- Net Sales: 40 Cr (Quarterly Results - Mar 2025)<BR>- Net Profit: 2 Cr (Quarterly Results - Mar 2025)<BR>- Market Cap: INR 11 Cr (Micro Cap)<BR><BR>Key Metrics:<BR>- P/E: 11.00<BR>- Industry P/E: 37<BR>- Dividend Yield: 0.00%<BR>- Debt-Equity: 0.34<BR>- Return on Equity: 6.11%<BR>- Price to Book: 1.13<BR><BR>Contact Details:<BR>Address: 133 Kanchan Bag, Indore Madhya Pradesh: 452001 <BR>Tel: 91-731-25076375/3046366 <BR>Email: beryldrugs25@yahoo.com <BR>Website: http://www.beryldurgs.com

View full answer

Who are the top shareholders of the Beryl Drugs?

17-Jul-2025

The top shareholders of Beryl Drugs include promoter Sanjay Sethi with 10.88% and public shareholder Samir Narendra Gupta with 4%. Individual investors collectively hold 68.69%, with no institutional holdings or pledged shares reported.

The top shareholders of Beryl Drugs include Sanjay Sethi, who is the promoter with the highest holding at 10.88%. The highest public shareholder is Samir Narendra Gupta, holding 4%. Additionally, individual investors collectively hold a significant portion of the company at 68.69%. There are no institutional holdings or pledged promoter shares reported.

View full answer

How big is Beryl Drugs?

24-Jul-2025

As of 24th July, Beryl Drugs Ltd has a market capitalization of 10.00 Cr, with recent net sales of 21.14 Cr and a net profit of 0.58 Cr. The balance sheet for March 2024 shows shareholder's funds of 8.92 Cr and total assets of 17.38 Cr.

As of 24th July, Beryl Drugs Ltd has a market capitalization of 10.00 Cr, categorizing it as a Micro Cap company.<BR><BR>In the latest four quarters, Beryl Drugs reported Net Sales of 21.14 Cr and a Net Profit of 0.58 Cr.<BR><BR>The latest annual period for the balance sheet is March 2024, showing Shareholder's Funds of 8.92 Cr and Total Assets of 17.38 Cr.

View full answer

When is the next results date for Beryl Drugs?

30-Jul-2025

Beryl Drugs will announce its results on 07 August 2025.

Beryl Drugs will declare its results on 07 August 2025.

View full answer

Are Beryl Drugs latest results good or bad?

07-Aug-2025

Beryl Drugs' latest results are mixed; while Profit After Tax has improved to Rs 0.17 crore, net sales fell by 23.36% and standalone net profit dropped by 94.59%, leading to a 'Strong Sell' rating from MarketsMOJO. Overall, the significant declines in key metrics indicate a more negative outlook.

Beryl Drugs' latest financial results present a mixed picture. On one hand, the company has shown an improvement in Profit After Tax (PAT), reporting Rs 0.17 crore for the latest six-month period, which is a notable increase from Rs 0.08 crore in the previous year. This suggests that Beryl Drugs is making progress in terms of profitability.<BR><BR>However, the overall performance for the quarter ending June 2025 has been challenging. The company experienced a significant decline in key metrics, with net sales dropping by 23.36% year-over-year and standalone net profit declining by a staggering 94.59%. Additionally, the Profit Before Tax (PBT) has reached its lowest point in five quarters, indicating a negative trend in near-term performance.<BR><BR>The stock is currently rated as a 'Strong Sell' by MarketsMOJO, reflecting the concerns surrounding its financial outlook. Overall, while there are some positive signs in profitability, the substantial declines in sales and profit metrics suggest that the results are more negative than positive.

View full answer

Is Beryl Drugs overvalued or undervalued?

03-Sep-2025

As of September 2, 2025, Beryl Drugs is considered very attractive with a PE ratio of 12.71 and an EV to EBITDA of 7.30, indicating it is undervalued compared to peers like Sun Pharma and Divi's Lab, despite a challenging year-to-date performance of -29.05%, as it has achieved a 3-year return of 168.59%, significantly outperforming the Sensex.

As of 2 September 2025, Beryl Drugs has moved from an attractive to a very attractive valuation grade. The company is currently undervalued, with a PE ratio of 12.71, an EV to EBITDA of 7.30, and a ROCE of 10.96%. In comparison, its peers exhibit significantly higher valuations, such as Sun Pharma with a PE ratio of 32.69 and Divi's Lab at 70.48, indicating that Beryl Drugs offers a more favorable investment opportunity relative to its competitors.<BR><BR>Despite a challenging year-to-date performance of -29.05%, Beryl Drugs has shown resilience with a 3-year return of 168.59%, significantly outperforming the Sensex's 36.32% return during the same period. This suggests that the market may not fully recognize the company's potential, further supporting the conclusion that it is undervalued.

View full answer

How has been the historical performance of Beryl Drugs?

13-Nov-2025

Beryl Drugs' historical performance shows fluctuating financial metrics, with net sales peaking at 26.89 Cr in Mar'23 but declining to 21.15 Cr by Mar'25, while total operating income also fell from 27.16 Cr to 22.56 Cr in the same period. Despite a decrease in profits and total assets, cash flow from operating activities improved to 2.00 Cr in Mar'25.

Answer:<BR>The historical performance of Beryl Drugs shows a fluctuating trend in key financial metrics over the years.<BR><BR>Breakdown:<BR>Beryl Drugs' net sales peaked at 26.89 Cr in Mar'23 but declined to 21.15 Cr by Mar'25. Other operating income increased from 0.00 Cr in Mar'19 to 1.41 Cr in Mar'25, contributing to a total operating income that reached a high of 27.16 Cr in Mar'23 before falling to 22.56 Cr in Mar'25. The raw material cost also saw a decline from 14.23 Cr in Mar'23 to 11.12 Cr in Mar'25, while total expenditure decreased from 24.95 Cr in Mar'23 to 19.91 Cr in Mar'25. Operating profit (PBDIT) slightly decreased from 2.68 Cr in Mar'24 to 2.65 Cr in Mar'25, with profit before tax showing a decline from 1.01 Cr in Mar'24 to 0.87 Cr in Mar'25. Profit after tax also decreased from 0.77 Cr in Mar'24 to 0.58 Cr in Mar'25. The company's total assets decreased from 17.39 Cr in Mar'23 to 15.95 Cr in Mar'25, while total liabilities also fell from 17.39 Cr to 15.95 Cr during the same period. Cash flow from operating activities improved to 2.00 Cr in Mar'25, contrasting with previous years where it was zero. Overall, Beryl Drugs has experienced both growth and decline in various financial aspects, reflecting a complex performance trajectory.

View full answer

Should I buy, sell or hold Beryl Drugs?

15-Nov-2025

Why is Beryl Drugs Ltd falling/rising?

01-Feb-2026

As of 01-Feb, Beryl Drugs Ltd's stock price has risen to 22.50, reflecting a 2.32% increase due to short-term gains and sector outperformance. However, the stock has faced significant long-term challenges, declining 36.62% over the past year, indicating underlying weaknesses despite its current valuation attractiveness.

As of 01-Feb, Beryl Drugs Ltd is experiencing a rise in its stock price, currently at 22.50, which reflects an increase of 0.51 or 2.32%. This upward movement can be attributed to several factors. Firstly, the stock has outperformed its sector by 2.79% today and has shown consecutive gains over the last two days, accumulating a total return of 2.41% during this period. <BR><BR>In the context of recent performance, the stock has demonstrated resilience, gaining 1.12% over the past week while the benchmark Sensex has declined by 1.00%. However, it is important to note that despite the recent positive movement, the stock has faced significant challenges over the longer term, with a substantial decline of 36.62% over the past year, contrasting sharply with the Sensex's gain of 5.16% during the same timeframe.<BR><BR>Additionally, while the stock is trading at a discount compared to its peers' average historical valuations, it has a relatively attractive valuation with a Return on Capital Employed (ROCE) of 11. This suggests that despite its recent gains, the company has underlying weaknesses, including a poor long-term growth rate and a weak ability to service its debt, which could impact future performance. <BR><BR>In summary, the current rise in Beryl Drugs Ltd's stock price is primarily driven by short-term gains and sector outperformance, despite the backdrop of long-term challenges and underperformance relative to the broader market.

View full answer

Which are the latest news on Beryl Drugs?

02-Feb-2026

iScoreScore
Click here to find our call on this stock
Strong Sell
Sell
Hold
Buy
Strong Buy

MarketsMojo — Loved in India, Now Global

The power of Mojo is now in 29 countries. Explore global equities with the same cutting-edge features you love.

Dashboard

1

Weak Long Term Fundamental Strength with an average Return on Capital Employed (ROCE) of 7.27%

  • Poor long term growth as Net Sales has grown by an annual rate of 11.44% and Operating profit at 10.53% over the last 5 years
  • Company's ability to service its debt is weak with a poor EBIT to Interest (avg) ratio of 0.82
2

Flat results in Sep 25

3

Underperformed the market in the last 1 year

stock-summaryMojo Parameters

Mojo Parameters

Loading Valuation Snapshot...

Stock DNA

stock-summary
Industry

Pharmaceuticals & Biotechnology

stock-summary
Market cap

INR 11 Cr (Micro Cap)

stock-summary
P/E

48.00

stock-summary
Industry P/E

32

stock-summary
Dividend Yield

0.00%

stock-summary
Debt Equity

0.34

stock-summary
Return on Equity

2.42%

stock-summary
Price to Book

1.20

Revenue and Profits:
Net Sales:
5 Cr
(Quarterly Results - Sep 2025)
Net Profit:
0 Cr
stock-summaryTotal Returns
Total Returns (Price + Dividend) stock-summary
Dividend Yield (0%)
TimePeriod
Price Return
Dividend Return
Total Return
3 Months
-8.7%
0%
-8.7%
6 Months
4.48%
0%
4.48%
1 Year
-36.42%
0%
-36.42%
2 Years
-26.0%
0%
-26.0%
3 Years
56.83%
0%
56.83%
4 Years
79.84%
0%
79.84%
5 Years
149.32%
0%
149.32%

Beryl Drugs for the last several years.

Risk Adjusted Returns v/s stock-summary
Returns Beta
Icon
Beta has not been calculated since enough price history is not available
stock-summaryNews & Corporate Actions

News

Why is Beryl Drugs Ltd falling/rising?

Recent Price Movement and Trading Patterns

Beryl Drugs has experienced a notable fall over the past week, with a one-week return of -4.22%, considerably worse than the Sensex's decline of -1.69%. The stock's year-to-date performance is even more concerning, showing a decline of -9.74% compared to the Sensex's modest fall of -1.87%. Over the last year, the stock has plummeted by -37.16%, starkly contrasting with the Sensex's positive return of 9.56%. This persistent underperformance has been accompanied by erratic trading patterns, including a missed trading day within the last 20 sessions and a recent two-day consecutive fall resulting in a cumulative loss of 7.12%.

On 13-Jan, the stock opened with a gap down of -3.29%, signalling immediate bearish sentiment among inve...

Read full news article
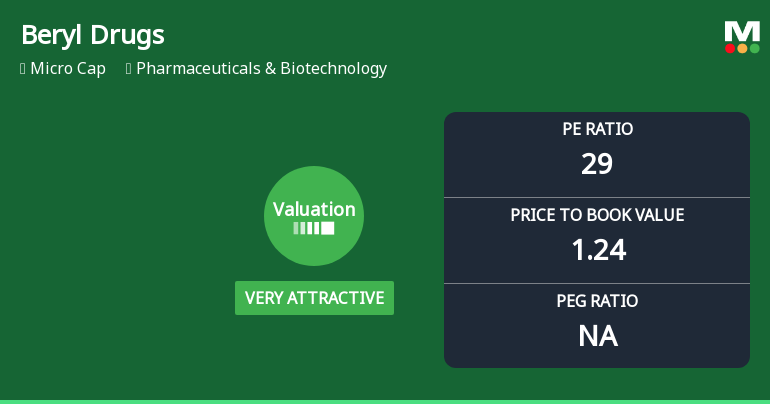
Announcements stock-summary

Board Meeting Intimation for To Consider And Approve The Unaudited Quarterly Financial Results For The Quarter Ended 31St December 2025

31-Jan-2026 | Source : BSE

Beryl Drugs Ltdhas informed BSE that the meeting of the Board of Directors of the Company is scheduled on 09/02/2026 inter alia to consider and approve 1. To consider and approve the date of holding EOGM for regularising the appointment of Mr. Shailendra Pathak as the Whole Time Director of the Company and fixing his role obligations and responsibilities and remuneration and for the appointment of Mrs. Neha Sarda as an Independent Director and for approval for material Related Party Transactions with M/s. Aminova Infusions P. Ltd. where Mr. Shailendra Pathak is a director holding 50% equity. 2. To consider and approve the Unaudited Quarterly Financial Results for the quarter ended 31st December 2025 3. To take on record the Limited Review Report by the Auditors for the quarter ended 31st December 2025

Announcement under Regulation 30 (LODR)-Cessation

05-Jan-2026 | Source : BSE

RESIGNATION OF MRS. NEHA SHARMA COMPANY SECRETARY OF THE COMPANY W.E.F 3RD JANUARY 2026

Appointment of Company Secretary and Compliance Officer

05-Jan-2026 | Source : BSE

APPOINTMENT OF MR. KAMLESH GUPTA AS COMPANY SECRETARY AND COMPLIANCE OFFICER OF THE COMPANY

Corporate Actions stock-summary

stock-summary
BOARD MEETING

09 Feb 2026

stock-summary
DIVIDEND

No Dividend history available

stock-summary
SPLITS

No Splits history available

stock-summary
BONUS

No Bonus history available

stock-summary
RIGHTS

No Rights history available

stock-summaryKey Factors

Quality key factors stock-summary

Factor
Value
Sales Growth (5y)
11.44%
EBIT Growth (5y)
10.53%
EBIT to Interest (avg)
0.82
Debt to EBITDA (avg)
2.81
Net Debt to Equity (avg)
0.34
Sales to Capital Employed (avg)
1.53
Tax Ratio
61.02%
Dividend Payout Ratio
0
Pledged Shares
0
Institutional Holding
0
ROCE (avg)
6.01%
ROE (avg)
4.99%

Valuation key factors

Factor
Value
P/E Ratio
48
Industry P/E
32
Price to Book Value
1.17
EV to EBIT
14.40
EV to EBITDA
6.10
EV to Capital Employed
1.13
EV to Sales
0.70
PEG Ratio
NA
Dividend Yield
NA
ROCE (Latest)
10.96%
ROE (Latest)
2.42%

Technicals key factors

Indicator
Weekly
Monthly
MACD
Bearish
Bearish
RSI
No Signal
No Signal
Bollinger Bands
Sideways
Bearish
Moving Averages
Mildly Bullish (Daily)
KST
Bearish
Bearish
Dow Theory
No Trend
No Trend
stock-summary Technical Indicator Scale: Bearish, Mildly Bearish, Sideways, Mildly Bullish, Bullish  Turned 
stock-summaryShareholding
Shareholding Snapshot : Dec 2025stock-summary
Shareholding Compare (%holding) stock-summary
Majority shareholders

Non Institution

Pledged Promoter Holdings

None

Mutual Funds

Held by 0 Schemes

FIIs

Held by 0 FIIs

Promoter with highest holding

Sanjay Sethi (10.88%)

Highest Public shareholder

Pradeep Kumar Jain (2.45%)

Individual Investors Holdings

66.25%

stock-summaryFinancial
[
  {
    "link": "quarterly",
    "btn_text": "All Quarterly Results",
    "header": "Quarterly Results Snapshot (Standalone) - Sep'25 - YoY",
    "rhs": [
      {
        "prefix": "Net Sales ",
        "suffix": "YoY Growth in quarter ended Sep 2025 is -8.73% vs -30.14% in Sep 2024",
        "dir": 1
      },
      {
        "prefix": "Standalone Net Profit ",
        "suffix": "YoY Growth in quarter ended Sep 2025 is 0.00% vs -96.30% in Sep 2024",
        "dir": 1
      }
    ],
    "table": {
      "header": [
        "Sep'25",
        "Sep'24",
        "Change(%)"
      ],
      "body": [
        {
          "field": "Net Sales",
          "val1": "5.12",
          "val2": "5.61",
          "chgp": "-8.73%",
          "chgp_class": "negative"
        },
        {
          "field": "Operating Profit (PBDIT) excl Other Income",
          "val1": "0.73",
          "val2": "0.56",
          "chgp": "30.36%",
          "chgp_class": "positive"
        },
        {
          "field": "Interest",
          "val1": "0.08",
          "val2": "0.12",
          "chgp": "-33.33%",
          "chgp_class": "positive"
        },
        {
          "field": "Exceptional Items",
          "val1": "0.00",
          "val2": "0.00",
          "chgp": "",
          "chgp_class": "neutral"
        },
        {
          "field": "Standalone Net Profit",
          "val1": "0.01",
          "val2": "0.01",
          "chgp": "",
          "chgp_class": "neutral"
        },
        {
          "field": "Operating Profit Margin (Excl OI)",
          "val1": "14.26%",
          "val2": "9.98%",
          "chgp": "4.28%",
          "chgp_class": "positive"
        }
      ]
    }
  },
  {
    "link": "half-yearly",
    "btn_text": "All Half Yearly Results",
    "header": "Half Yearly Results Snapshot (Standalone) - Sep'25",
    "rhs": [
      {
        "prefix": "Net Sales ",
        "suffix": " Growth in half year ended Sep 2025 is -16.44% vs -26.47% in Sep 2024",
        "dir": 1
      },
      {
        "prefix": "Standalone Net Profit ",
        "suffix": " Growth in half year ended Sep 2025 is -91.89% vs -53.75% in Sep 2024",
        "dir": -1
      }
    ],
    "table": {
      "header": [
        "Sep'25",
        "Sep'24",
        "Change(%)"
      ],
      "body": [
        {
          "field": "Net Sales",
          "val1": "9.91",
          "val2": "11.86",
          "chgp": "-16.44%",
          "chgp_class": "negative"
        },
        {
          "field": "Operating Profit (PBDIT) excl Other Income",
          "val1": "1.28",
          "val2": "1.55",
          "chgp": "-17.42%",
          "chgp_class": "negative"
        },
        {
          "field": "Interest",
          "val1": "0.18",
          "val2": "0.33",
          "chgp": "-45.45%",
          "chgp_class": "positive"
        },
        {
          "field": "Exceptional Items",
          "val1": "0.00",
          "val2": "0.00",
          "chgp": "",
          "chgp_class": "neutral"
        },
        {
          "field": "Standalone Net Profit",
          "val1": "0.03",
          "val2": "0.37",
          "chgp": "-91.89%",
          "chgp_class": "negative"
        },
        {
          "field": "Operating Profit Margin (Excl OI)",
          "val1": "12.92%",
          "val2": "13.07%",
          "chgp": "-0.15%",
          "chgp_class": "negative"
        }
      ]
    }
  },
  {
    "link": "nine-monthly",
    "btn_text": "All Nine Monthly Results",
    "header": "Nine Monthly Results Snapshot (Standalone) - Dec'24",
    "rhs": [
      {
        "prefix": "Net Sales ",
        "suffix": "YoY Growth in nine months ended Dec 2024 is -27.71% vs 14.35% in Dec 2023",
        "dir": -1
      },
      {
        "prefix": "Standalone Net Profit ",
        "suffix": "YoY Growth in nine months ended Dec 2024 is -62.16% vs 58.57% in Dec 2023",
        "dir": -1
      }
    ],
    "table": {
      "header": [
        "Dec'24",
        "Dec'23",
        "Change(%)"
      ],
      "body": [
        {
          "field": "Net Sales",
          "val1": "17.17",
          "val2": "23.75",
          "chgp": "-27.71%",
          "chgp_class": "negative"
        },
        {
          "field": "Operating Profit (PBDIT) excl Other Income",
          "val1": "2.14",
          "val2": "2.65",
          "chgp": "-19.25%",
          "chgp_class": "negative"
        },
        {
          "field": "Interest",
          "val1": "0.45",
          "val2": "0.33",
          "chgp": "36.36%",
          "chgp_class": "negative"
        },
        {
          "field": "Exceptional Items",
          "val1": "0.00",
          "val2": "0.00",
          "chgp": "",
          "chgp_class": "neutral"
        },
        {
          "field": "Standalone Net Profit",
          "val1": "0.42",
          "val2": "1.11",
          "chgp": "-62.16%",
          "chgp_class": "negative"
        },
        {
          "field": "Operating Profit Margin (Excl OI)",
          "val1": "12.35%",
          "val2": "11.08%",
          "chgp": "1.27%",
          "chgp_class": "positive"
        }
      ]
    }
  },
  {
    "link": "annual",
    "btn_text": "All Annual Results",
    "header": "Annual Results Snapshot (Standalone) - Mar'25",
    "rhs": [
      {
        "prefix": "Net Sales ",
        "suffix": "YoY Growth in year ended Mar 2025 is -20.88% vs -0.60% in Mar 2024",
        "dir": -1
      },
      {
        "prefix": "Standalone Net Profit ",
        "suffix": "YoY Growth in year ended Mar 2025 is -24.68% vs 0.00% in Mar 2024",
        "dir": -1
      }
    ],
    "table": {
      "header": [
        "Mar'25",
        "Mar'24",
        "Change(%)"
      ],
      "body": [
        {
          "field": "Net Sales",
          "val1": "21.15",
          "val2": "26.73",
          "chgp": "-20.88%",
          "chgp_class": "negative"
        },
        {
          "field": "Operating Profit (PBDIT) excl Other Income",
          "val1": "2.65",
          "val2": "2.68",
          "chgp": "-1.12%",
          "chgp_class": "negative"
        },
        {
          "field": "Interest",
          "val1": "0.53",
          "val2": "0.46",
          "chgp": "15.22%",
          "chgp_class": "negative"
        },
        {
          "field": "Exceptional Items",
          "val1": "0.00",
          "val2": "0.00",
          "chgp": "",
          "chgp_class": "neutral"
        },
        {
          "field": "Standalone Net Profit",
          "val1": "0.58",
          "val2": "0.77",
          "chgp": "-24.68%",
          "chgp_class": "negative"
        },
        {
          "field": "Operating Profit Margin (Excl OI)",
          "val1": "12.53%",
          "val2": "10.03%",
          "chgp": "2.50%",
          "chgp_class": "positive"
        }
      ]
    }
  }
]

Quarterly Results Snapshot (Standalone) - Sep'25 - YoYstock-summary

Sep'25
Sep'24
Change(%)
Net Sales
5.12
5.61
-8.73%
Operating Profit (PBDIT) excl Other Income
0.73
0.56
30.36%
Interest
0.08
0.12
-33.33%
Exceptional Items
0.00
0.00
Standalone Net Profit
0.01
0.01
Operating Profit Margin (Excl OI)
14.26%
9.98%
4.28%
Values in Rs Cr.
Direction Arrows
Net Sales

YoY Growth in quarter ended Sep 2025 is -8.73% vs -30.14% in Sep 2024

Direction Arrows
Standalone Net Profit

YoY Growth in quarter ended Sep 2025 is 0.00% vs -96.30% in Sep 2024

Half Yearly Results Snapshot (Standalone) - Sep'25stock-summary

Sep'25
Sep'24
Change(%)
Net Sales
9.91
11.86
-16.44%
Operating Profit (PBDIT) excl Other Income
1.28
1.55
-17.42%
Interest
0.18
0.33
-45.45%
Exceptional Items
0.00
0.00
Standalone Net Profit
0.03
0.37
-91.89%
Operating Profit Margin (Excl OI)
12.92%
13.07%
-0.15%
Values in Rs Cr.
Direction Arrows
Net Sales

Growth in half year ended Sep 2025 is -16.44% vs -26.47% in Sep 2024

Direction Arrows
Standalone Net Profit

Growth in half year ended Sep 2025 is -91.89% vs -53.75% in Sep 2024

Nine Monthly Results Snapshot (Standalone) - Dec'24stock-summary

Dec'24
Dec'23
Change(%)
Net Sales
17.17
23.75
-27.71%
Operating Profit (PBDIT) excl Other Income
2.14
2.65
-19.25%
Interest
0.45
0.33
36.36%
Exceptional Items
0.00
0.00
Standalone Net Profit
0.42
1.11
-62.16%
Operating Profit Margin (Excl OI)
12.35%
11.08%
1.27%
Values in Rs Cr.
Direction Arrows
Net Sales

YoY Growth in nine months ended Dec 2024 is -27.71% vs 14.35% in Dec 2023

Direction Arrows
Standalone Net Profit

YoY Growth in nine months ended Dec 2024 is -62.16% vs 58.57% in Dec 2023

Annual Results Snapshot (Standalone) - Mar'25stock-summary

Mar'25
Mar'24
Change(%)
Net Sales
21.15
26.73
-20.88%
Operating Profit (PBDIT) excl Other Income
2.65
2.68
-1.12%
Interest
0.53
0.46
15.22%
Exceptional Items
0.00
0.00
Standalone Net Profit
0.58
0.77
-24.68%
Operating Profit Margin (Excl OI)
12.53%
10.03%
2.50%
Values in Rs Cr.
Direction Arrows
Net Sales

YoY Growth in year ended Mar 2025 is -20.88% vs -0.60% in Mar 2024

Direction Arrows
Standalone Net Profit

YoY Growth in year ended Mar 2025 is -24.68% vs 0.00% in Mar 2024

stock-summaryCompany CV
About Beryl Drugs Ltd stock-summary
stock-summary
Beryl Drugs Ltd
Micro Cap
Pharmaceuticals & Biotechnology
Beryl Drugs Limited was incorporated on August 24, 1993. The Company acquired the running business of M/s Flora and Fauna Remedies Limited on December 15, 1993. The Shares of Company were listed on M.P. Stock Exchange, Bombay Stock Exchange and Ahmedabad Stock Exchange. The Company thereafter has been engaged in the manufacture, sale, and export of branded, generic pharmaceutical formulations in India and internationally. It offers I.V. fluids, and a range of small and large volume injectables.
Company Coordinates stock-summary
Company Details
133 Kanchan Bag , Indore Madhya Pradesh : 452001
stock-summary
Tel: 91-731-25076375/3046366
stock-summary
beryldrugs25@yahoo.com
Registrar Details
Adroit Corporate Services Pvt Ltd, 17-20 Jaferbhoy Industrial Estate , 1st Floor, Makwana Road, Marol Naka, Mumbai