
Compare Ahluwalia Contr. with Similar Stocks
Stock DNA
Construction
INR 5,711 Cr (Small Cap)
22.00
46
0.07%
-0.36
12.91%
2.82
Total Returns (Price + Dividend) 
Latest dividend: 0.5974158415841584 per share ex-dividend date: Sep-22-2025
Risk Adjusted Returns v/s
Returns Beta

News

Ahluwalia Contracts (India) Ltd is Rated Hold
Ahluwalia Contracts (India) Ltd is rated 'Hold' by MarketsMOJO, with this rating last updated on 02 June 2026. However, the analysis and financial metrics discussed here reflect the stock's current position as of 30 June 2026, providing investors with the latest insights into its performance and outlook.
Read full news article
Ahluwalia Contracts (India) Ltd is Rated Hold
Ahluwalia Contracts (India) Ltd is rated 'Hold' by MarketsMOJO, with this rating last updated on 02 June 2026. While the rating was revised on that date, the analysis and financial metrics discussed here reflect the company’s current position as of 19 June 2026, providing investors with the most up-to-date view of its fundamentals, returns, and market standing.
Read full news article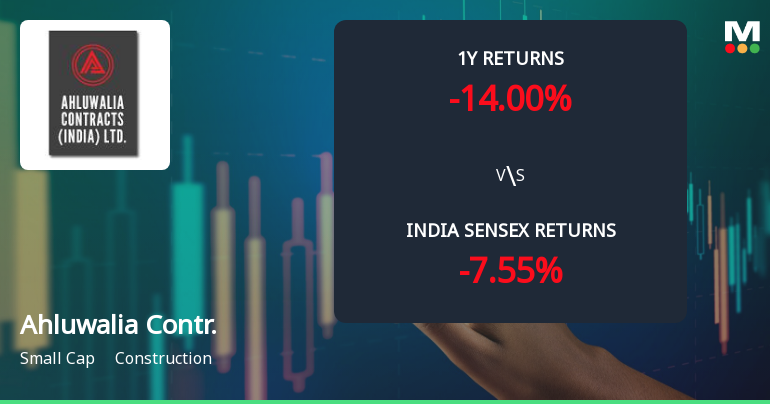
Ahluwalia Contracts (India) Ltd Technical Momentum Shifts Amid Mixed Market Signals
Ahluwalia Contracts (India) Ltd, a small-cap player in the construction sector, has experienced a notable shift in its technical momentum, reflecting a complex interplay of bullish and bearish signals across multiple timeframes. With a recent upgrade in its Mojo Grade from Sell to Hold, the stock’s price action and technical indicators warrant close examination as investors seek clarity amid mixed trends.
Read full news article Announcements
Board Meeting Outcome for Revised Outcome
11-Jun-2026 | Source : BSERevised outcome
31-03-2026 (Standalone And Consolidated Results
11-Jun-2026 | Source : BSERevised due to some clerical error
Announcement under Regulation 30 (LODR)-Meeting Updates
10-Jun-2026 | Source : BSEOut-Come of Board Meeting Held on 30-05-2026 which was filled with exchanges Refile with BSE Portal again with all Reports
Corporate Actions

No Upcoming Board Meetings

Ahluwalia Contracts (India) Ltd has declared 30% dividend, ex-date: 22 Sep 25

Ahluwalia Contracts (India) Ltd has announced 2:10 stock split, ex-date: 14 Sep 07

No Bonus history available

No Rights history available
Quality key factors
Valuation key factors
Technicals key factors
 Technical Indicator Scale: Bearish, Mildly Bearish, Sideways, Mildly Bullish, Bullish Turned
 Shareholding Snapshot : Mar 2026
Shareholding Compare (%holding)
Promoters
None
Held by 18 Schemes (21.8%)
Held by 97 FIIs (13.74%)
Sudershan Walia (30.53%)
Sbi Small Cap Fund (8.51%)
7.25%
Quarterly Results Snapshot (Consolidated) - Mar'26 - YoY

YoY Growth in quarter ended Mar 2026 is 8.76% vs 4.48% in Mar 2025
YoY Growth in quarter ended Mar 2026 is -1.57% vs -58.29% in Mar 2025
Half Yearly Results Snapshot (Consolidated) - Sep'25

Growth in half year ended Sep 2025 is 13.02% vs 15.95% in Sep 2024
Growth in half year ended Sep 2025 is 87.44% vs -33.92% in Sep 2024
Nine Monthly Results Snapshot (Consolidated) - Dec'25
YoY Growth in nine months ended Dec 2025 is 12.49% vs 7.10% in Dec 2024
YoY Growth in nine months ended Dec 2025 is 54.81% vs -32.31% in Dec 2024
Annual Results Snapshot (Consolidated) - Mar'26
YoY Growth in year ended Mar 2026 is 11.38% vs 6.31% in Mar 2025
YoY Growth in year ended Mar 2026 is 31.56% vs -46.09% in Mar 2025
About Ahluwalia Contracts (India) Ltd

Company Coordinates


