
Compare Garware Marine with Similar Stocks
Dashboard
With a Operating Losses, the company has a Weak Long Term Fundamental Strength
- Company's ability to service its debt is weak with a poor EBIT to Interest (avg) ratio of -0.07
- The company has been able to generate a Return on Equity (avg) of 1.09% signifying low profitability per unit of shareholders funds
Flat results in Mar 26
With ROE of 1.4, it has a Very Expensive valuation with a 1.2 Price to Book Value
Underperformed the market in the last 1 year
Stock DNA
Garments & Apparels
INR 12 Cr (Micro Cap)
83.00
32
0.00%
0.00
1.45%
1.28
Total Returns (Price + Dividend) 
Latest dividend: 0.5 per share ex-dividend date: Dec-20-2011
Risk Adjusted Returns v/s
Returns Beta

News
Are Garware Marine Industries Ltd latest results good or bad?
Garware Marine Industries Ltd's financial results for Q4 FY26 reveal significant operational challenges, particularly in profitability. The company reported net sales of ₹0.26 crores, reflecting an 8.33% increase compared to the same quarter last year, but this was accompanied by a sequential decline of 13.33% from the previous quarter. This modest revenue growth contrasts sharply with the company's net profit, which turned negative at -₹0.05 crores, a stark decline from a profit of ₹0.11 crores in Q4 FY25. The operating margin fell dramatically to -23.08%, a decline of 43.91 percentage points year-on-year, indicating severe cost pressures or pricing challenges that the company has been unable to address. Additionally, the profit before depreciation, interest, and tax (PBDIT) also turned negative, marking the lowest operational performance in over two years. This deterioration in profitability metrics rais...
Read full news article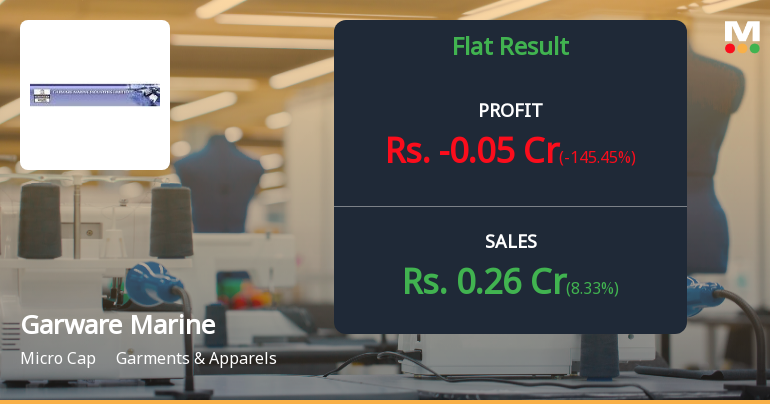
Garware Marine Q4 FY26: Operating Loss Deepens as Margins Turn Sharply Negative
Garware Marine Industries Ltd., a micro-cap player in the garments and apparels sector with a market capitalisation of ₹14.00 crores, reported deeply concerning results for Q4 FY26 (January-March 2026), posting a net loss of ₹0.05 crores against a profit of ₹0.11 crores in the year-ago quarter. The company's operating performance deteriorated sharply, with operating margins collapsing to -23.08% from 20.83% a year earlier, marking the worst quarterly performance in recent history. The stock has declined 0.77% following the results announcement, trading at ₹23.12 and reflecting investor anxiety over the company's operational trajectory.
Read full news article Announcements
Board Meeting Outcome for Outcome Of The Board Meeting Held Today 22Nd June 2026
22-Jun-2026 | Source : BSEKindly take on record the outcome of the Board Meeting held today 22nd June 2026. The Board has approved the shifting of registered office of the Company from 03rd Floor Prospect Chambers Fort Mumbai 400001 to A/304 Naman Midtown Senapati Bapat Marg Prabhadevi (West) Mumbai 400013 within same City w.e.f. 23rd June 2026.
Announcement under Regulation 30 (LODR)-Change in Registered Office Address
22-Jun-2026 | Source : BSEKindly take on your record that pursuant to Reg 30 of SEBI LODR Regulation 2015 the Board of Directors in its meeting held today 22nd June 2026 has approved the shifting of Registered Office from 03rd Floor Prospect Chambers D. N. Road Fort Mumbai 400001 to A/304 Naman Midtown Senapati Bapat Marg Pabhadevi (West) Mumbai 400013 within the local limit of the city of Mumbai with effect from 23rd June 20206.
Compliances-Reg.24(A)-Annual Secretarial Compliance
14-May-2026 | Source : BSEKindly take on your record the SEBI Secretarial Compliance Audit Report as on 31st March 2026 as per Reg 24(A) of SEBI LODR Regulations 2015.
Corporate Actions

No Upcoming Board Meetings

Garware Marine Industries Ltd has declared 5% dividend, ex-date: 20 Dec 11

No Splits history available

No Bonus history available

No Rights history available
Quality key factors
Valuation key factors
Technicals key factors
 Technical Indicator Scale: Bearish, Mildly Bearish, Sideways, Mildly Bullish, Bullish Turned
 Shareholding Snapshot : Mar 2026
Shareholding Compare (%holding)
Non Institution
None
Held by 0 Schemes
Held by 0 FIIs
Sushma Ashok Garware (16.23%)
Shri Krishna Welfare Trust (2.87%)
47.42%
Quarterly Results Snapshot (Standalone) - Mar'26 - YoY

YoY Growth in quarter ended Mar 2026 is 8.33% vs 60.00% in Mar 2025
YoY Growth in quarter ended Mar 2026 is -145.45% vs 257.14% in Mar 2025
Half Yearly Results Snapshot (Standalone) - Sep'25
Growth in half year ended Sep 2025 is -25.71% vs 94.44% in Sep 2024
Growth in half year ended Sep 2025 is -42.31% vs 1,400.00% in Sep 2024
Nine Monthly Results Snapshot (Standalone) - Dec'25
YoY Growth in nine months ended Dec 2025 is -15.46% vs 90.20% in Dec 2024
YoY Growth in nine months ended Dec 2025 is -37.50% vs 0.00% in Dec 2024
Annual Results Snapshot (Standalone) - Mar'26
YoY Growth in year ended Mar 2026 is -10.00% vs 81.82% in Mar 2025
YoY Growth in year ended Mar 2026 is -65.12% vs 714.29% in Mar 2025
About Garware Marine Industries Ltd

Company Coordinates


