
Compare Lotus Chocolate with Similar Stocks
Dashboard
Low ability to service debt as the company has a high Debt to EBITDA ratio of 9.85 times
- Low ability to service debt as the company has a high Debt to EBITDA ratio of 9.85 times
Poor long term growth as Operating profit has grown by an annual rate -258.12% of over the last 5 years
The company has declared Negative results for the last 4 consecutive quarters
Risky - Negative EBITDA
29.23% of Promoter Shares are Pledged
Total Returns (Price + Dividend) 
Lotus Chocolate for the last several years.
Risk Adjusted Returns v/s
Returns Beta

News
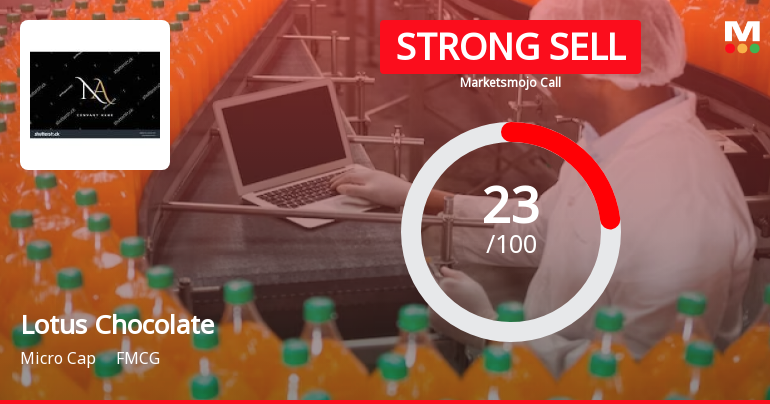
Lotus Chocolate Company Ltd is Rated Strong Sell
Lotus Chocolate Company Ltd is rated Strong Sell by MarketsMOJO, with this rating last updated on 14 October 2025. However, the analysis and financial metrics discussed here reflect the stock's current position as of 16 June 2026, providing investors with the latest insights into the company’s performance and outlook.
Read full news article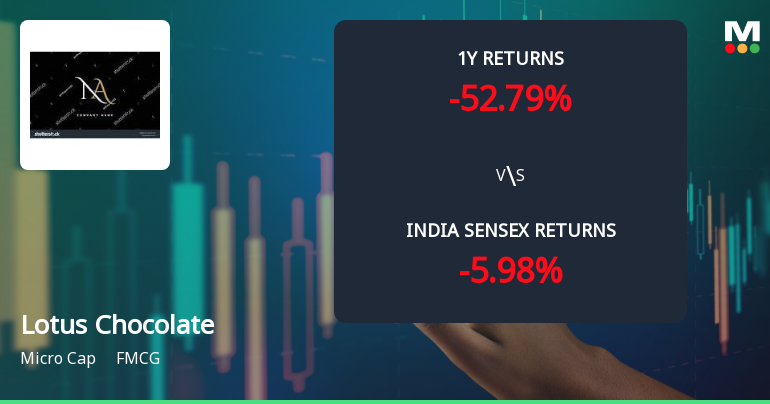
Lotus Chocolate Company Ltd Technical Momentum Shifts Amid Bearish Sentiment
Lotus Chocolate Company Ltd, a micro-cap player in the FMCG sector, has experienced a nuanced shift in its technical momentum, moving from a bearish to a mildly bearish stance. Despite a marginal day change of 0.01%, the stock’s technical indicators reveal a complex interplay of bullish and bearish signals, underscoring the challenges faced by investors amid a prolonged downtrend.
Read full news article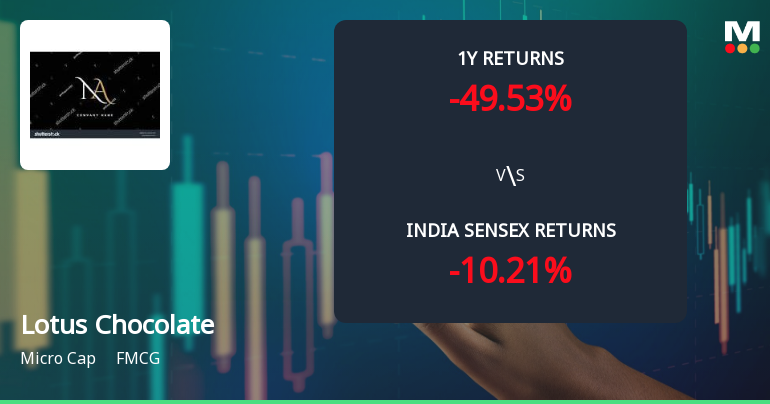
Lotus Chocolate Company Ltd Faces Bearish Momentum Amid Technical Downturn
Lotus Chocolate Company Ltd, a micro-cap player in the FMCG sector, has seen a notable shift in its technical momentum, with key indicators signalling a bearish trend. The company’s stock price has declined by 2.01% today to ₹685.70, reflecting growing investor caution amid deteriorating technical parameters and a recent downgrade in its Mojo Grade to Strong Sell.
Read full news article Announcements
Compliances-Reg.24(A)-Annual Secretarial Compliance
28-May-2026 | Source : BSEThe Secretarial Compliance Report for the financial year ended March 31 2026 duly issued by M/s. KSR & Co Company Secretaries LLP is attached.
Shareholder Meeting / Postal Ballot-Outcome of Postal_Ballot
23-May-2026 | Source : BSEPlease find attached Scrutinizers Report along with voting results on the postal ballot activity.
Shareholder Meeting / Postal Ballot-Scrutinizers Report
23-May-2026 | Source : BSEPlease find attached Scrutinizers Report along with voting result on the postal ballot activity.
Corporate Actions

No Upcoming Board Meetings

No Dividend history available

No Splits history available

No Bonus history available

No Rights history available
Quality key factors
Valuation key factors
Technicals key factors
 Technical Indicator Scale: Bearish, Mildly Bearish, Sideways, Mildly Bullish, Bullish Turned
 Shareholding Snapshot : Mar 2026
Shareholding Compare (%holding)
Promoters
29.231
Held by 0 Schemes
Held by 2 FIIs (0.01%)
Reliance Consumer Products Limited (formerly Known As Tira Beauty Limited) (51.0%)
Voderbettu Shivaram Kamath (1.59%)
24.85%
Quarterly Results Snapshot (Standalone) - Mar'26 - QoQ

QoQ Growth in quarter ended Mar 2026 is -5.13% vs -16.71% in Dec 2025

QoQ Growth in quarter ended Mar 2026 is -3,292.86% vs -90.28% in Dec 2025
Half Yearly Results Snapshot (Standalone) - Sep'25
Growth in half year ended Sep 2025 is 18.38% vs 227.50% in Sep 2024
Growth in half year ended Sep 2025 is -63.36% vs 2,586.67% in Sep 2024
Nine Monthly Results Snapshot (Standalone) - Dec'25
YoY Growth in nine months ended Dec 2025 is 8.77% vs 210.15% in Dec 2024
YoY Growth in nine months ended Dec 2025 is -71.09% vs 1,405.71% in Dec 2024
Annual Results Snapshot (Standalone) - Mar'26
YoY Growth in year ended Mar 2026 is 1.01% vs 186.83% in Mar 2025
YoY Growth in year ended Mar 2026 is -99.42% vs 240.51% in Mar 2025
About Lotus Chocolate Company Ltd

Company Coordinates


