
Compare Andhra Cements with Similar Stocks
Dashboard
With HIgh Debt (Debt-Equity Ratio at 13.87 times)- the company has a Weak Long Term Fundamental Strength
- Poor long term growth as Operating profit has grown by an annual rate 0% of over the last 5 years
- Low ability to service debt as the company has a high Debt to EBITDA ratio of 70.18 times
Risky - Negative Operating Profits
31.67% of Promoter Shares are Pledged
Consistent Underperformance against the benchmark over the last 3 years
Stock DNA
Cement & Cement Products
INR 490 Cr (Micro Cap)
NA (Loss Making)
34
0.00%
13.87
-83.18%
6.15
Total Returns (Price + Dividend) 
Andhra Cements for the last several years.
Risk Adjusted Returns v/s
Returns Beta

News
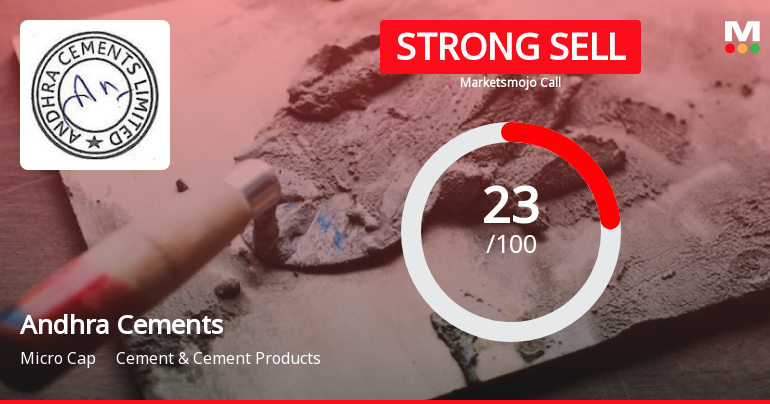
Andhra Cements Ltd is Rated Strong Sell
Andhra Cements Ltd is rated Strong Sell by MarketsMOJO, with this rating last updated on 14 January 2026. However, the analysis and financial metrics discussed here reflect the stock’s current position as of 15 June 2026, providing investors with the latest insights into the company’s fundamentals, valuation, financial trends, and technical outlook.
Read full news article
Andhra Cements Ltd is Rated Strong Sell
Andhra Cements Ltd is rated Strong Sell by MarketsMOJO, with this rating last updated on 14 January 2026. However, the analysis and financial metrics presented here reflect the stock’s current position as of 04 June 2026, providing investors with an up-to-date view of the company’s fundamentals, valuation, financial trends, and technical outlook.
Read full news article
Andhra Cements Ltd is Rated Strong Sell
Andhra Cements Ltd is rated Strong Sell by MarketsMOJO, with this rating last updated on 14 Jan 2026. However, the analysis and financial metrics presented here reflect the stock’s current position as of 24 May 2026, providing investors with an up-to-date view of the company’s fundamentals, valuation, financial trends, and technical outlook.
Read full news article Announcements
Shifting Of Registered Office - ROC Certificate
19-Jun-2026 | Source : BSESubmission of ROC certificate with regard to the shifting of Registered Office
Board Meeting Outcome for Merger Of Andhra Cements Limited With Its Holding Company Sagar Cements Limited
05-Jun-2026 | Source : BSESubmission of the Outcome of the Board Meeting
Announcement under Regulation 30 (LODR)-Newspaper Publication
01-Jun-2026 | Source : BSESubmission of Newspaper Publication
Corporate Actions

No Upcoming Board Meetings

No Dividend history available

No Splits history available

No Bonus history available

No Rights history available
Quality key factors
Valuation key factors
Technicals key factors
 Technical Indicator Scale: Bearish, Mildly Bearish, Sideways, Mildly Bullish, Bullish Turned
 Shareholding Snapshot : Mar 2026
Shareholding Compare (%holding)
Promoters
31.6667
Held by 5 Schemes (0.0%)
Held by 0 FIIs
Sagar Cements Limited (90.0%)
None
12.74%
Quarterly Results Snapshot (Standalone) - Mar'26 - YoY

YoY Growth in quarter ended Mar 2026 is 73.07% vs -2.58% in Mar 2025
YoY Growth in quarter ended Mar 2026 is 197.21% vs -165.76% in Mar 2025
Half Yearly Results Snapshot (Standalone) - Sep'25

Growth in half year ended Sep 2025 is 50.00% vs 50.93% in Sep 2024
Growth in half year ended Sep 2025 is -22.35% vs -128.04% in Sep 2024
Nine Monthly Results Snapshot (Standalone) - Dec'25
YoY Growth in nine months ended Dec 2025 is 55.83% vs 4.71% in Dec 2024
YoY Growth in nine months ended Dec 2025 is -13.19% vs -118.24% in Dec 2024
Annual Results Snapshot (Standalone) - Mar'25
YoY Growth in year ended Mar 2025 is 2.22% vs 0.00% in Mar 2024
YoY Growth in year ended Mar 2025 is -131.84% vs -106.91% in Mar 2024
About Andhra Cements Ltd

Company Coordinates


