
Compare L T Foods with Similar Stocks
Stock DNA
Other Agricultural Products
INR 13,421 Cr (Small Cap)
22.00
32
0.77%
0.28
13.83%
3.00
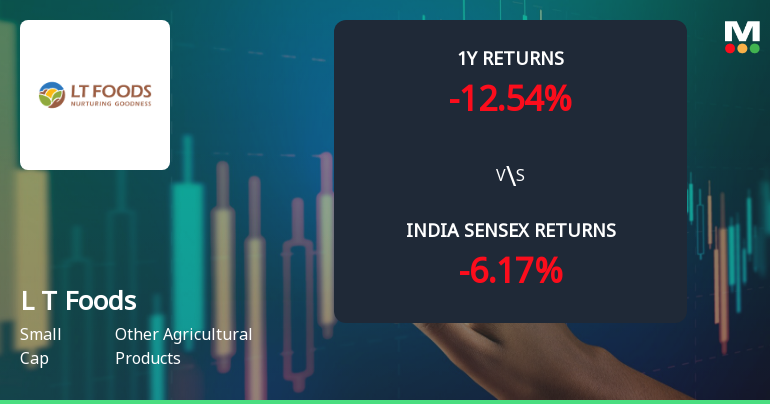
Total Returns (Price + Dividend) 
Latest dividend: 0.9816939890710383 per share ex-dividend date: Feb-02-2026
Risk Adjusted Returns v/s
Returns Beta

News
L T Foods Ltd Technical Momentum Shifts Amid Mixed Indicator Signals
L T Foods Ltd has exhibited a subtle shift in its technical momentum, moving from a sideways trend to a mildly bullish stance, despite a complex mix of indicator signals. The stock’s recent price action, combined with nuanced readings from MACD, RSI, moving averages, and other technical tools, paints a cautiously optimistic picture for investors navigating the Other Agricultural Products sector.
Read full news article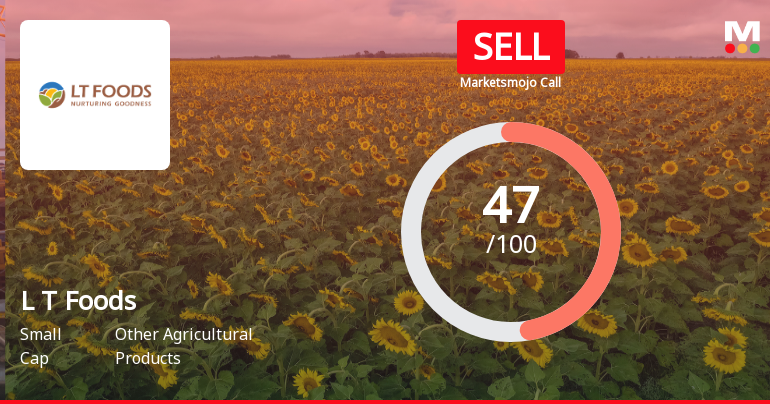
L T Foods Ltd Downgraded to Sell Amid Technical and Financial Weakness
L T Foods Ltd, a prominent player in the Other Agricultural Products sector, has seen its investment rating downgraded from Hold to Sell by MarketsMOJO as of 22 June 2026. This revision reflects a combination of deteriorating technical indicators, disappointing recent financial results, and valuation concerns despite some strengths in management efficiency and debt servicing. The company’s Mojo Score now stands at 47.0, signalling caution for investors amid sideways technical trends and underperformance relative to the broader market.
Read full news article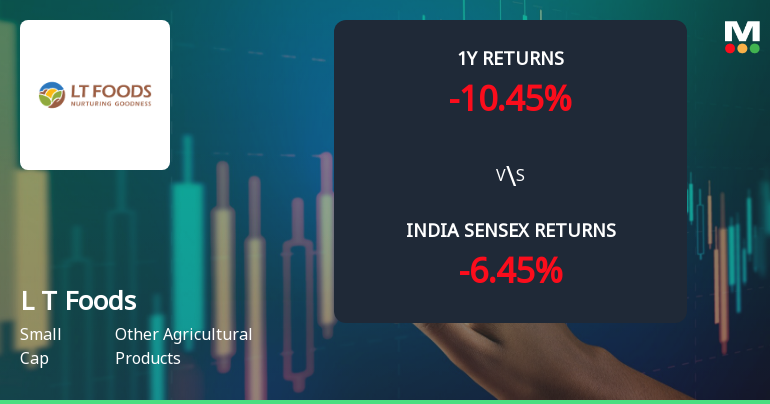
L T Foods Ltd Technical Momentum Shifts Amid Mixed Market Signals
L T Foods Ltd, a small-cap player in the Other Agricultural Products sector, has experienced a notable shift in its technical momentum, moving from a mildly bullish stance to a sideways trend. Despite a modest day gain of 0.95% to close at ₹386.40, the stock’s technical indicators present a complex picture, with bearish signals on weekly and monthly MACD and Bollinger Bands contrasting with mildly bullish daily moving averages. This nuanced technical landscape, coupled with a recent downgrade in its Mojo Grade from Hold to Sell, warrants a detailed analysis for investors seeking clarity on the stock’s near-term trajectory.
Read full news article Announcements
Incorporation Of A Wholly Owned Subsidiary Company
23-Jun-2026 | Source : BSEIncorporation of wholly owned subsidiary Company
Announcement under Regulation 30 (LODR)-Newspaper Publication
18-Jun-2026 | Source : BSECopies of Newspaper Publication- Postal Ballot
Announcement under Regulation 30 (LODR)-Analyst / Investor Meet - Intimation
18-Jun-2026 | Source : BSEIntimation of Schedule of Analysts/ Conference Meeting
Corporate Actions

No Upcoming Board Meetings

L T Foods Ltd has declared 100% dividend, ex-date: 02 Feb 26

L T Foods Ltd has announced 1:10 stock split, ex-date: 07 Feb 17

No Bonus history available

No Rights history available
Quality key factors
Valuation key factors
Technicals key factors
 Technical Indicator Scale: Bearish, Mildly Bearish, Sideways, Mildly Bullish, Bullish Turned
 Shareholding Snapshot : Mar 2026
Shareholding Compare (%holding)
Promoters
None
Held by 19 Schemes (9.02%)
Held by 149 FIIs (8.74%)
Raghuvesh Holdings Private Limited (9.61%)
Salic International Investment Company (9.22%)
16.84%
Quarterly Results Snapshot (Consolidated) - Mar'26 - YoY

YoY Growth in quarter ended Mar 2026 is 30.44% vs 7.40% in Mar 2025

YoY Growth in quarter ended Mar 2026 is -15.48% vs 7.91% in Mar 2025
Half Yearly Results Snapshot (Consolidated) - Sep'25
Growth in half year ended Sep 2025 is 25.16% vs 11.25% in Sep 2024
Growth in half year ended Sep 2025 is 10.21% vs 2.78% in Sep 2024
Nine Monthly Results Snapshot (Consolidated) - Dec'25
YoY Growth in nine months ended Dec 2025 is 24.57% vs 13.26% in Dec 2024
YoY Growth in nine months ended Dec 2025 is 10.09% vs 0.05% in Dec 2024
Annual Results Snapshot (Consolidated) - Mar'26
YoY Growth in year ended Mar 2026 is 26.08% vs 11.70% in Mar 2025
YoY Growth in year ended Mar 2026 is 3.31% vs 2.02% in Mar 2025
About L T Foods Ltd

Company Coordinates


