
Compare Deco-Mica with Similar Stocks
Dashboard
Weak Long Term Fundamental Strength with a 12.28% CAGR growth in Operating Profits over the last 5 years
- Low ability to service debt as the company has a high Debt to EBITDA ratio of 3.97 times
- The company has been able to generate a Return on Equity (avg) of 8.48% signifying low profitability per unit of shareholders funds
Negative results in Dec 25
Below par performance in long term as well as near term
Stock DNA
Commodity Chemicals
INR 26 Cr (Micro Cap)
17.00
45
0.00%
0.87
5.64%
0.94
Total Returns (Price + Dividend) 
Deco-Mica for the last several years.
Risk Adjusted Returns v/s
Returns Beta

News

Deco-Mica Ltd is Rated Strong Sell
Deco-Mica Ltd is rated Strong Sell by MarketsMOJO, with this rating last updated on 03 Dec 2025. However, the analysis and financial metrics discussed here reflect the stock’s current position as of 15 May 2026, providing investors with an up-to-date view of the company’s fundamentals, returns, and market performance.
Read full news article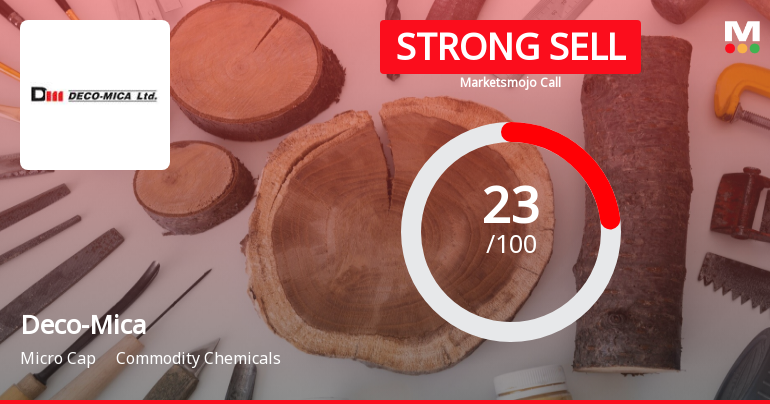
Deco-Mica Ltd is Rated Strong Sell
Deco-Mica Ltd is rated Strong Sell by MarketsMOJO. This rating was last updated on 03 Dec 2025, reflecting a reassessment of the stock’s outlook. However, all fundamentals, returns, and financial metrics discussed below are current as of 17 April 2026, providing investors with the latest perspective on the company’s position.
Read full news article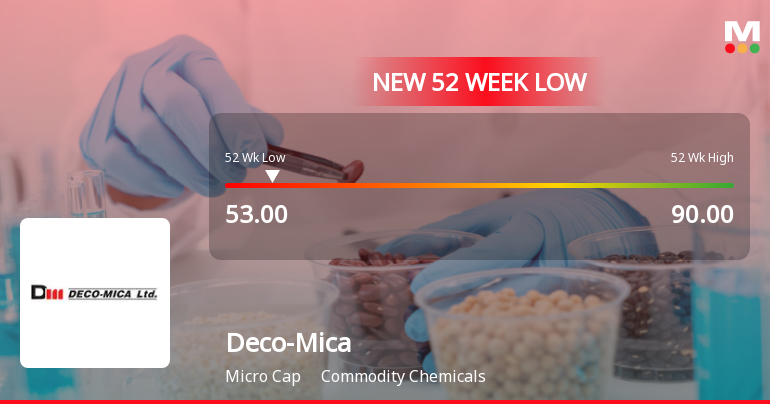
Deco-Mica Ltd Falls to 52-Week Low of Rs 51.24 as Sell-Off Deepens
A sharp decline in Deco-Mica Ltd shares has pushed the stock to a fresh 52-week low of Rs 51.24 on 2 Apr 2026, marking a significant 43.1% drop from its 52-week high of Rs 90. This fall comes amid a broader market downturn, but the stock’s underperformance relative to its sector and benchmark indices highlights company-specific pressures.
Read full news article Announcements
Format of the Annual Disclosure to be made by an entity identified as a LC - Annexure B2
13-May-2026 | Source : BSEFormat of the Annual Disclosure to be made by an entity identified as a Large Corporate.
| Sr. No. | Particulars | Details |
| 1 | Name of Company | Deco Mica Ltd |
| 2 | CIN NO. | L20299GJ1988PLC010807 |
| 3 | Report filed for FY | 2025-2026 |
| Details of the Current block (all figures in Rs crore): | ||
| 4 | 2 - year block period (Specify financial years)* | FY 2025-26 and FY 2024-25 |
| 5 | Incremental borrowing done in FY (T)(a) | 0.00 |
| 6 | Mandatory borrowing to be done through debt securities in FY (T) (b) = (25% of a) | 0.00 |
| 7 | Actual borrowing done through debt securities in FY (T)(c) | 0.00 |
| 8 | Shortfall in the borrowing through debt securities if any for FY (T - 1) carried forward to FY (T) (d) | 0 |
| 8 | Quantum of (d) which has been met from (c)(e)* | 0 |
| 9 | Shortfall if any in the mandatory borrowing through debt securities for FY (T) { after adjusting for any shortfall in borrowing for FY(T - 1) which was carried forward to FY(T)}(f) = (b) - [(c) - (e)]{ If the calculated value is zero or negative write nil}* | 0 |
| Details of penalty to be paid if any in respect to previous block (all figures in Rs crore): | |
| 2 - year Block period (Specify financial years) | FY 2024-25 and FY 2023-24 |
| Amount of fine to be paid for the block if applicable Fine = 0.2% of {(d) - (e)}# | 0.00 |
| Name of the Company Secretary :- | Florica Savan Patel |
| Designation :- | Company Secretary and Compliance Officer |
| Name of the Chief Financial Officer :- | Vishal Agarwal |
| Designation : - | Director and CFO |
Date: 13/05/2026
Format of the Initial Disclosure to be made by an entity identified as a Large Corporate : Annexure A
28-Apr-2026 | Source : BSEFormat of Initial Disclosure to be made by an entity identified as a Large Corporate.
| Sr. No. | Particulars | Details |
| 1 | Name of Company | Deco Mica Ltd |
| 2 | CIN NO. | L20299GJ1988PLC010807 |
| 3 | Outstanding borrowing of company as on 31st March / 31st December as applicable (in Rs cr) | 23.58 |
| 4 | Highest Credit Rating during the previous FY | NA |
| 4a | Name of the Credit Rating Agency issuing the Credit Rating mentioned in (4) | Not Applicable |
| 5 | Name of Stock Exchange# in which the fine shall be paid in case of shortfall in the required borrowing under the framework | BSE |
Designation: Company Secretary and Compliance Officer
EmailId: cs@heritagesurfaces.com
Designation: Chief Financial officer and Director
EmailId: Vishal@heritagesurfaces.com
Date: 28/04/2026
Note: In terms para of 3.2(ii) of the circular beginning F.Y 2022 in the event of shortfall in the mandatory borrowing through debt securities a fine of 0.2% of the shortfall shall be levied by Stock Exchanges at the end of the two-year block period. Therefore an entity identified as LC shall provide in its initial disclosure for a financial year the name of Stock Exchange to which it would pay the fine in case of shortfall in the mandatory borrowing through debt markets.
Compliances-Certificate under Reg. 74 (5) of SEBI (DP) Regulations 2018
10-Apr-2026 | Source : BSECertificate under Regulation 74(5) of the SEBI (Depositories and Participants) Regulations 2018 for the quarter ended 31st March 2026
Corporate Actions

No Upcoming Board Meetings

No Dividend history available

No Splits history available

No Bonus history available

No Rights history available
Quality key factors
Valuation key factors
Technicals key factors
 Technical Indicator Scale: Bearish, Mildly Bearish, Sideways, Mildly Bullish, Bullish Turned
 Shareholding Snapshot : Mar 2026
Shareholding Compare (%holding)
Promoters
None
Held by 0 Schemes
Held by 0 FIIs
Vijaykumar D Agarwal (37.53%)
Mahendra Girdharilal (2.52%)
27.75%
Quarterly Results Snapshot (Standalone) - Dec'25 - QoQ

QoQ Growth in quarter ended Dec 2025 is 1.03% vs 7.32% in Sep 2025

QoQ Growth in quarter ended Dec 2025 is 253.85% vs -188.64% in Sep 2025
Half Yearly Results Snapshot (Standalone) - Sep'25
Growth in half year ended Sep 2025 is -6.51% vs -2.05% in Sep 2024
Growth in half year ended Sep 2025 is -68.75% vs -76.47% in Sep 2024
Nine Monthly Results Snapshot (Standalone) - Dec'25
YoY Growth in nine months ended Dec 2025 is -10.23% vs 6.51% in Dec 2024
YoY Growth in nine months ended Dec 2025 is -39.25% vs 64.62% in Dec 2024
Annual Results Snapshot (Standalone) - Mar'25
YoY Growth in year ended Mar 2025 is -1.57% vs -1.32% in Mar 2024
YoY Growth in year ended Mar 2025 is -15.58% vs 1.32% in Mar 2024
About Deco-Mica Ltd

Company Coordinates


