
Compare Sterling Green with Similar Stocks
Dashboard
With a Operating Losses, the company has a Weak Long Term Fundamental Strength
- Low ability to service debt as the company has a high Debt to EBITDA ratio of 12.41 times
- The company has reported losses. Due to this company has reported negative ROE
Flat results in Dec 25
With ROCE of 0.8, it has a Very Expensive valuation with a 0.9 Enterprise value to Capital Employed
Below par performance in long term as well as near term
Stock DNA
Hotels & Resorts
INR 8 Cr (Micro Cap)
NA (Loss Making)
35
0.00%
1.13
-7.00%
0.72
Total Returns (Price + Dividend) 
Latest dividend: 0.9000 per share ex-dividend date: Sep-21-2011
Risk Adjusted Returns v/s
Returns Beta

News
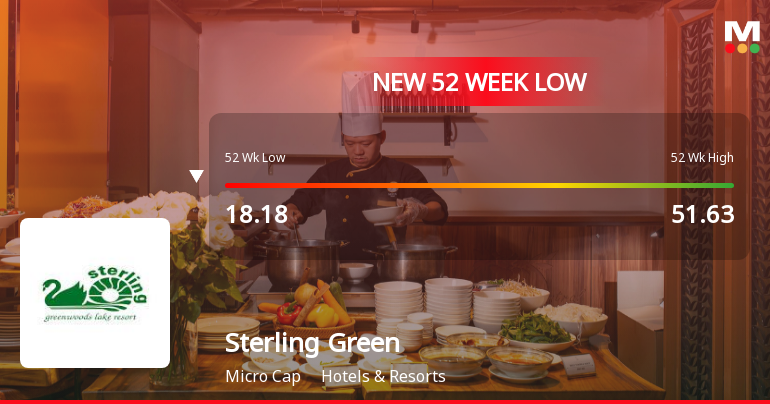
Sterling Green Woods Ltd Falls to 52-Week Low of Rs 16.25 as Sell-Off Deepens
A sharp decline has pushed Sterling Green Woods Ltd to a fresh 52-week low of Rs 16.25 on 2 Apr 2026, marking a significant 68.5% drop from its peak of Rs 51.63 within the last year. This steep fall comes amid a broader market downturn, but the stock’s underperformance far exceeds sector and benchmark indices.
Read full news article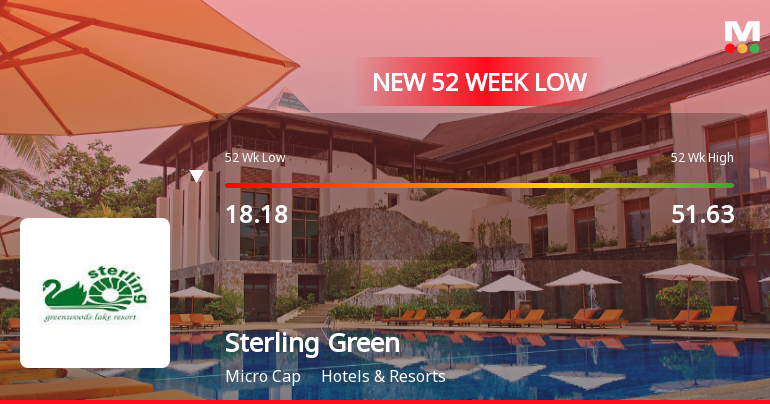
Sterling Green Woods Ltd Falls to 52-Week Low of Rs 16.26 as Sell-Off Deepens
For the second consecutive session, Sterling Green Woods Ltd has succumbed to selling pressure, slipping to a fresh 52-week low of Rs 16.26 on 30 Mar 2026. This decline extends the stock’s downward trajectory, which has now erased nearly 10% of its value over two days amid broader market weakness.
Read full news article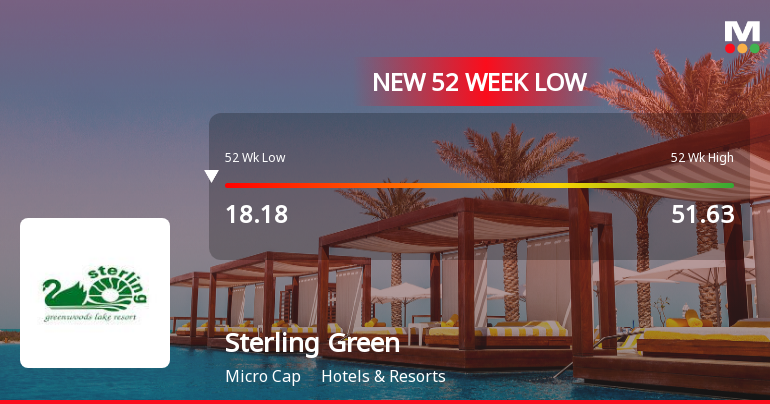
Announcements
STERLING GREENWOODS LIMITED INFORMED THE EXCHANGE ABOUT NON-APPLICABILITY OF SEBI CIRCULAR - SEBI/HO/DDHS-RACP0D1/P/CIR/2023/172 DTD.19TH OCTOBER 2023 - FUND RAISING BY ISSUANCE OF DEBT SECURITIES BY LARGE CORPORATE ENTITIES
29-Apr-2026 | Source : BSEWith reference to the above captioned subject and as per SEBI circulars in respect of fund raising by issuance of debt securities by Large Corporate (LC) and disclosure and Compliance by LC we hereby inform you that STERLING GREENWOODS LIMITED is not falling under the category / framework of Large Corporate (LC) as defined under the above said circulars and details of the same are mentioned in Annexure-A enclosed herewith.
Board Meeting Outcome for Outcome Of Meeting Of Board Of Directors Held On April 27 2026
27-Apr-2026 | Source : BSEPursuant to recommendation received from the Nomination and Remuneration Committee of the Company the Board has approved the appointment of Ms. Brinda Dineshkumar Nathvani (ACS: A70352) as Company Secretary and Compliance Officer of the Company with effect from April 27 2026.
Closure of Trading Window
26-Mar-2026 | Source : BSEIntimation for Closure of Trading Window for the Quarter and Financial Year Ended on March 31 2026
Corporate Actions

No Upcoming Board Meetings

Sterling Green Woods Ltd has declared 9% dividend, ex-date: 21 Sep 11

No Splits history available

No Bonus history available

No Rights history available
Quality key factors
Valuation key factors
Technicals key factors
 Technical Indicator Scale: Bearish, Mildly Bearish, Sideways, Mildly Bullish, Bullish Turned
 Shareholding Snapshot : Mar 2026
Shareholding Compare (%holding)
Non Institution
None
Held by 0 Schemes
Held by 0 FIIs
Umeshbhai Ghanshyambhai Lavingia (48.45%)
Kailash Ramavatar Goenka (5.08%)
49.92%
Quarterly Results Snapshot (Consolidated) - Dec'25 - QoQ

QoQ Growth in quarter ended Dec 2025 is 0.00% vs -50.00% in Sep 2025
QoQ Growth in quarter ended Dec 2025 is 41.82% vs -14.58% in Sep 2025
Half Yearly Results Snapshot (Consolidated) - Sep'25

Growth in half year ended Sep 2025 is -90.32% vs -82.18% in Sep 2024
Growth in half year ended Sep 2025 is 10.43% vs -43.75% in Sep 2024
Nine Monthly Results Snapshot (Consolidated) - Dec'25
YoY Growth in nine months ended Dec 2025 is -87.50% vs -86.27% in Dec 2024
YoY Growth in nine months ended Dec 2025 is 18.18% vs -7.84% in Dec 2024
Annual Results Snapshot (Consolidated) - Mar'25
YoY Growth in year ended Mar 2025 is -41.77% vs -36.15% in Mar 2024
YoY Growth in year ended Mar 2025 is 51.87% vs -55.83% in Mar 2024
About Sterling Green Woods Ltd

Company Coordinates


