
Compare Olympic Cards with Similar Stocks
Dashboard
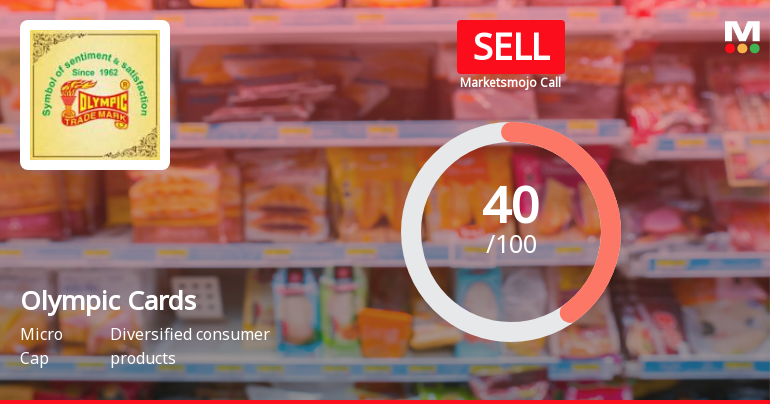
With HIgh Debt (Debt-Equity Ratio at 12.76 times)- the company has a Weak Long Term Fundamental Strength
- Low ability to service debt as the company has a high Debt to EBITDA ratio of -6.20 times
- The company has reported losses. Due to this company has reported negative ROE
Flat results in Mar 26
Risky - Negative EBITDA
Below par performance in long term as well as near term
Stock DNA
Diversified consumer products
INR 5 Cr (Micro Cap)
NA (Loss Making)
12
0.00%
12.76
-24.53%
4.62
Total Returns (Price + Dividend) 
Latest dividend: 0.5 per share ex-dividend date: Sep-07-2015
Risk Adjusted Returns v/s
Returns Beta

News
Olympic Cards Ltd Upgraded to Sell on Technical Improvements Despite Financial Challenges
Olympic Cards Ltd, a micro-cap player in the diversified consumer products sector, has seen its investment rating upgraded from Strong Sell to Sell as of 8 July 2026. This change is primarily driven by a marked improvement in technical indicators, even as the company continues to grapple with weak financial fundamentals and elevated debt levels. The stock’s recent price surge of 14.29% and a shift in technical trends have prompted analysts to revise their outlook, though caution remains warranted given the company’s underlying challenges.
Read full news article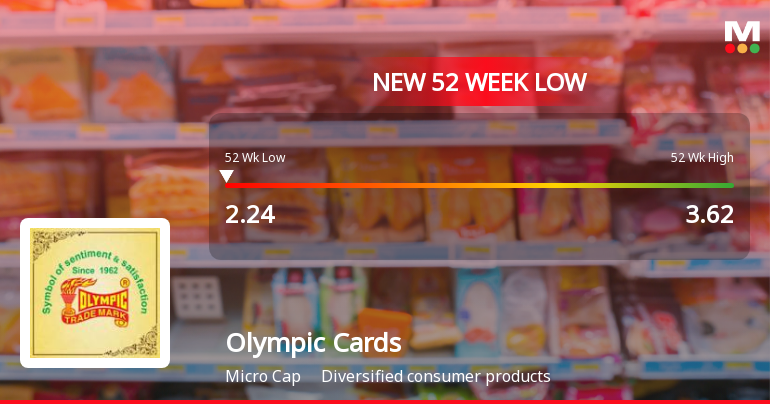
Markets Rally, But Olympic Cards Ltd Sinks to 52-Week Low in Stock-Specific Sell-Off
While the Sensex has gained steadily over the past three weeks, Olympic Cards Ltd has diverged sharply, hitting a fresh 52-week low of Rs 2.24 on 7 Jul 2026. The stock’s recent two-day slide has erased over 21% of its value, underscoring persistent headwinds amid a broadly positive market backdrop.
Read full news article
Olympic Cards Ltd Downgraded to Strong Sell Amidst Weak Financials and Technical Setbacks
Olympic Cards Ltd, a micro-cap player in the diversified consumer products sector, has been downgraded from a Sell to a Strong Sell rating by MarketsMOJO as of 3 July 2026. This revision reflects deteriorating technical indicators, persistently weak financial performance, and challenging valuation metrics, signalling heightened risk for investors amid ongoing market underperformance.
Read full news article Announcements
Compliances-Certificate under Reg. 74 (5) of SEBI (DP) Regulations 2018
14-Jul-2026 | Source : BSEBased on the confirmation received from Cameo Corporate Services Limited Registrar and Share Transfer Agent of the Company we hereby certify that the securities received for dematerialization have been mutilated and cancelled after due verification and the name of the depository has been substituted in our records as the registered owner with stipulated time limit of receipt of certificate of security and the details are furnished to the stock exchange. Further we certify that the securities which were dematerialized are listed on the Bombay Stock Exchange where the earlier issued securities are listed.
Announcement Under Regulation 30 (LODR)-Updates (Response To The Communication Dt 01-07-2026 Received From BSE Under Listing Centre-Dash Board- Corporate Governance Reg 17(1A)-Appt Of Mr. Alagarsamy Uthandan Independent Director-Clarification-Reg.
11-Jul-2026 | Source : BSEIn response to the communication dated 1-7-2026 received from BSE under Listing Centre-Dash Board-Corporate Governance we wish to inform that Regulation 17(1A) of SEBI (LODR) Regulations 2015 states that No listed entity shall appoint a person or continue the directorship of any person as a Non-Executive Director who has attained the age of 75 years unless a special Resolution is passed to that effect. Mr. Alagarsamy Uthandan (DIN:07847682) (Date of Birth: 17.07.1952) Independent Director will be completing the age of 75 years on 16.07.2027. His first term of appointment through a Special Resolution as an Independent Director has ended on 9th June 2026 and our company has passed a Special Resolution for his re-appointment for a second term of five years from 10.06.2026 in the Annual General Meeting held on 20.09.2025. This is for your kind information and record.
Announcement under Regulation 30 (LODR)-Newspaper Publication
08-Jul-2026 | Source : BSEPursuant to Regulation 30 read with Schedule III Part A Para A of the SEBI (LODR) Regulations 2015 as amended from time to time and in accordance with the SEBI Circular HO/38/13/11(2)2026-MIRSD-POD/1/3750/2026 dated 30th January 2026 we hereby enclosed the copies of the newspaper advertisement published for the Equity Shareholders of the Company regarding the Special Window for Transfer and Dematerialisation of Physical Securities. The said advertisement was published in Business Standard (English) and Makkal Kural (Tamil).
Corporate Actions

No Upcoming Board Meetings

Olympic Cards Ltd has declared 5% dividend, ex-date: 07 Sep 15

No Splits history available

No Bonus history available

No Rights history available
Quality key factors
Valuation key factors
Technicals key factors
 Technical Indicator Scale: Bearish, Mildly Bearish, Sideways, Mildly Bullish, Bullish Turned
 Shareholding Snapshot : Mar 2026
Shareholding Compare (%holding)
Promoters
None
Held by 0 Schemes
Held by 0 FIIs
N Mohamed Faizal (40.93%)
Surekha Chaudhary (2.22%)
32.79%
Quarterly Results Snapshot (Standalone) - Mar'26 - QoQ

QoQ Growth in quarter ended Mar 2026 is -44.64% vs 10.16% in Dec 2025
QoQ Growth in quarter ended Mar 2026 is -146.83% vs 431.00% in Dec 2025
Half Yearly Results Snapshot (Standalone) - Sep'25

Growth in half year ended Sep 2025 is 22.54% vs -29.93% in Sep 2024
Growth in half year ended Sep 2025 is 12.55% vs -36.69% in Sep 2024
Nine Monthly Results Snapshot (Standalone) - Dec'25
YoY Growth in nine months ended Dec 2025 is 31.39% vs -27.92% in Dec 2024
YoY Growth in nine months ended Dec 2025 is 137.39% vs -19.79% in Dec 2024
Annual Results Snapshot (Standalone) - Mar'26
YoY Growth in year ended Mar 2026 is 10.95% vs -18.17% in Mar 2025
YoY Growth in year ended Mar 2026 is 94.08% vs -326.21% in Mar 2025
About Olympic Cards Ltd

Company Coordinates


