
Compare Bluegod Enterta. with Similar Stocks
Total Returns (Price + Dividend) 
Bluegod Enterta. for the last several years.
Risk Adjusted Returns v/s
Returns Beta

News
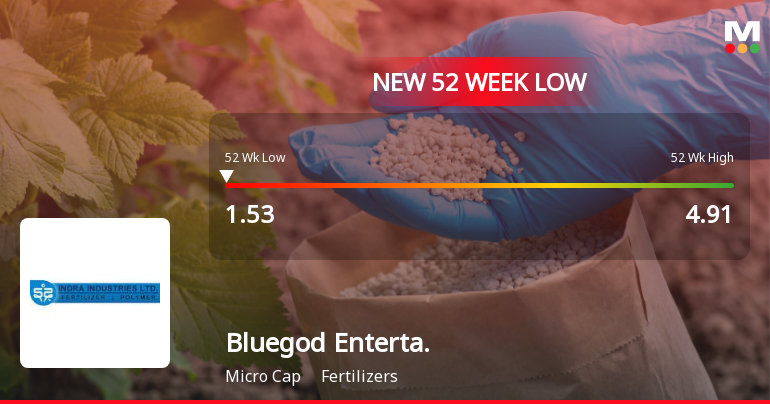
Bluegod Entertainment Ltd Falls to 52-Week Low of Rs 1.53 as Sell-Off Deepens
A sharp decline has pushed Bluegod Entertainment Ltd to a fresh 52-week low of Rs 1.53 on 13 Jul 2026, marking a significant drop from its 52-week high of Rs 4.91. The stock’s underperformance contrasts with the broader market, as the Sensex trades above its 50-day moving average despite a modest pullback.
Read full news article
Bluegod Entertainment Ltd is Rated Sell
Bluegod Entertainment Ltd is rated Sell by MarketsMOJO, with this rating last updated on 08 May 2026. However, the analysis and financial metrics discussed here reflect the stock’s current position as of 08 July 2026, providing investors with the latest insights into its performance and outlook.
Read full news article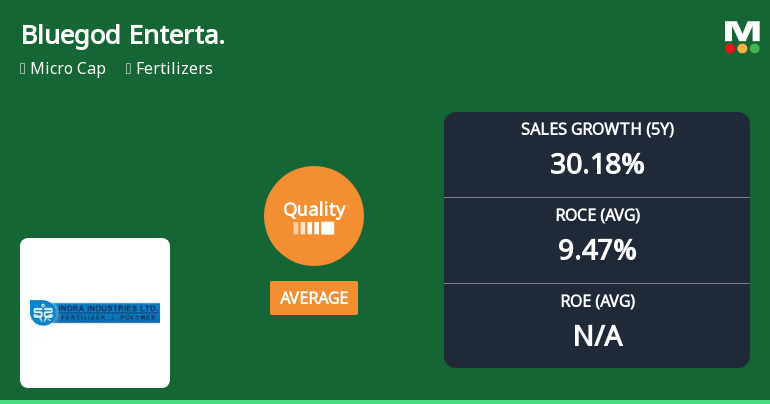
Bluegod Entertainment Ltd Quality Grade Downgrade: A Detailed Analysis of Business Fundamentals
Bluegod Entertainment Ltd, a micro-cap player in the fertilisers sector, has seen its quality grade downgraded from good to average as of 8 May 2026, reflecting notable changes in its business fundamentals. This shift comes amid a challenging market environment and evolving financial metrics, prompting a reassessment of the company’s operational efficiency, profitability, and capital structure.
Read full news article Announcements
Announcement under Regulation 30 (LODR)-Newspaper Publication
07-Jul-2026 | Source : BSENewspaper Clippings of Audited Financial Results
Compliances-Certificate under Reg. 74 (5) of SEBI (DP) Regulations 2018
06-Jul-2026 | Source : BSECertificate under Regulation 74(5) of SEBI (DP) Regulations 2018 for the Quarter ended 30th june 2026
Board Meeting Outcome for Outcome Of The Meeting Of The Board Of Directors Of Bluegod Entertainment Limited Held Today Saturday I.E 04Th July 2026.
04-Jul-2026 | Source : BSEOutcome of the Meeting of the Board of Directors of Bluegod Entertainment Limited held today Saturday i.e 04th July 2026.
Corporate Actions

No Upcoming Board Meetings

No Dividend history available

Bluegod Entertainment Ltd has announced 1:10 stock split, ex-date: 02 Sep 25

No Bonus history available

Bluegod Entertainment Ltd has announced 9:47 rights issue, ex-date: 06 Mar 26
Quality key factors
Valuation key factors
Technicals key factors
 Technical Indicator Scale: Bearish, Mildly Bearish, Sideways, Mildly Bullish, Bullish Turned
 Shareholding Snapshot : Mar 2026
Shareholding Compare (%holding)
Non Institution
None
Held by 0 Schemes
Held by 0 FIIs
None
Ravi V Somani (14.53%)
80.94%
Quarterly Results Snapshot (Standalone) - Mar'26 - YoY

YoY Growth in quarter ended Mar 2026 is -100.00% vs 1,600.00% in Mar 2025
YoY Growth in quarter ended Mar 2026 is -191.98% vs 950.00% in Mar 2025
Half Yearly Results Snapshot (Standalone) - Sep'25

Growth in half year ended Sep 2025 is 0.00% vs -100.00% in Sep 2024
Growth in half year ended Sep 2025 is -529.17% vs -1,300.00% in Sep 2024
Nine Monthly Results Snapshot (Standalone) - Dec'25
YoY Growth in nine months ended Dec 2025 is 4,515.38% vs -18.75% in Dec 2024
YoY Growth in nine months ended Dec 2025 is 35,800.00% vs -102.50% in Dec 2024
Annual Results Snapshot (Standalone) - Mar'26
YoY Growth in year ended Mar 2026 is 421.74% vs 411.11% in Mar 2025
YoY Growth in year ended Mar 2026 is 1.65% vs 970.59% in Mar 2025
About Bluegod Entertainment Ltd

Company Coordinates


