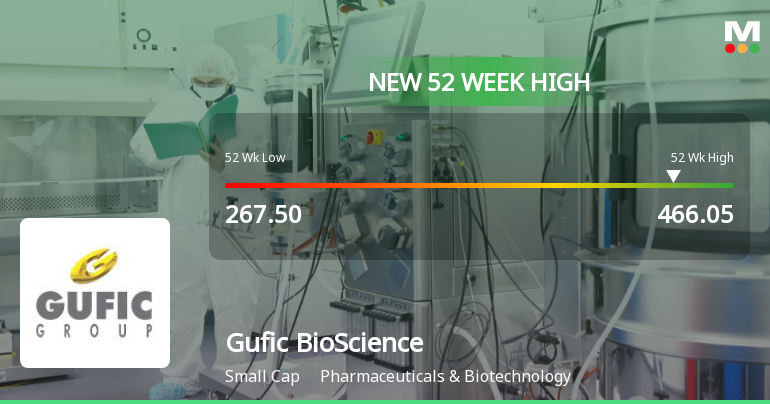
Gufic BioScience

  • Market Cap: Small Cap
  • Industry: Pharmaceuticals & Biotechnology
  • ISIN: INE742B01025
  • NSEID: GUFICBIO
  • BSEID: 509079
INR
441.65
6.05 (1.39%)
BSENSE

Sep 21, 01:15 PM

BSE+NSE Vol: 50.13 k

  • Price Points
  • Score
  • Mojo Parameters
  • Total Return
  • News and Corporate Actions
  • Key factors
  • Shareholding
  • Financials
  • CompanyCV
stock-summaryPrice Point
High/Low

1Day

52 Week

Valuation
Technical
Day's Volume

CASH

50.13 k (-2.64%) Volume

Shareholding (Jun 2026)

FII

0.46%

Held by 25 FIIs

DII

3.67%

Held by 4 DIIs

Promoter

72.50%

Why is Gufic BioSciences Ltd falling/rising?

06-Sep-2026

As of 05-Sep, Gufic BioSciences Ltd's stock price is at 445.40, reflecting a 1.17% increase. The stock has shown strong performance with significant gains over various periods, outperforming the Sensex, and has reported impressive financial results, indicating a robust upward trend.

As of 05-Sep, Gufic BioSciences Ltd's stock price is rising, currently at 445.40, reflecting an increase of 5.15 (1.17%). The stock has demonstrated strong performance over various time frames, with a notable 8.89% increase over the past week and a 12.26% rise over the past month, significantly outperforming the Sensex, which has declined by 0.97% and 2.44% respectively during the same periods. Year-to-date, the stock has risen by 32.26%, while the Sensex has fallen by 10.21%. <BR><BR>Additionally, Gufic BioSciences has been gaining consistently, with an 8.03% return over the last five days. The stock is trading above its moving averages across multiple time frames, indicating a strong upward trend. Furthermore, the company reported positive financial results, including a 112.65% growth in profit after tax over the last six months and a high debtors turnover ratio. <BR><BR>Despite a recent decline in investor participation, as evidenced by a 39.34% drop in delivery volume, the stock remains liquid enough for trading. Overall, the combination of strong financial performance, consistent gains, and market outperformance contributes to the rising stock price of Gufic BioSciences Ltd.

View full answer

Who are in the management team of Gufic BioScience?

01-Sep-2026

The management team of Gufic BioScience includes Chairman & Managing Director Jayesh P Choksi, CEO Pranav J Choksi, and several whole-time directors, along with a board of non-executive and independent directors, bringing diverse expertise to the company.

The management team of Gufic BioScience includes the following members:<BR><BR>1. **Jayesh P Choksi** - Chairman & Managing Director<BR>2. **Pranav J Choksi** - Whole Time Director & CEO<BR>3. **Pankaj Gandhi** - Whole-time Director<BR>4. **Dilip Ghosh** - Whole-time Director<BR>5. **Ami Naresh Shah** - Company Secretary & Compliance Officer<BR><BR>Additionally, the board features several non-executive and independent directors:<BR><BR>1. **Shreyas Patel** - Non-Executive & Independent Director<BR>2. **Gopal Daptari** - Non-Executive & Independent Director<BR>3. **Shrirang V Vadiya** - Non-Executive & Independent Director<BR>4. **Rabi Narayan Sahoo** - Non-Executive & Independent Director<BR>5. **Anusanjiv Aurora** - Non-Executive & Independent Director<BR>6. **Balram Singh** - Non-Executive & Non-Independent Director<BR><BR>This diverse team brings a range of expertise to the company.

View full answer

What does Gufic BioScience do?

01-Sep-2026

Gufic BioSciences Ltd is a global pharmaceutical company in the Pharmaceuticals & Biotechnology sector, known for a wide range of services and classified as a Small Cap company. As of June 2026, it reported net sales of 261 Cr and a net profit of 22 Cr, with a market cap of INR 4,071 Cr.

Overview:<BR>Gufic BioSciences Ltd is a prominent global pharmaceutical enterprise dedicated to delivering a broad spectrum of pharmaceutical services, operating within the Pharmaceuticals & Biotechnology industry and classified as a Small Cap company.<BR><BR>History:<BR>Gufic BioSciences Ltd was incorporated in an unspecified year and is recognized as one of the top 100 pharmaceutical companies in India. The latest quarterly results reported net sales and profit for June 2026.<BR><BR>Financial Snapshot:<BR>Most recent Net Sales: 261 Cr (Quarterly Results - Jun 2026) <BR>Most recent Net Profit: 22 Cr (Quarterly Results - Jun 2026) <BR>Market-cap value: INR 4,071 Cr (Small Cap)<BR><BR>Key Metrics:<BR>P/E: 57.00 <BR>Industry P/E: 37 <BR>Dividend Yield: 0.05% <BR>Debt-Equity: 0.49 <BR>Return on Equity: 9.66% <BR>Price to Book: 6.15 <BR><BR>Contact Details:<BR>Address: Shop-37 1st Flr Kamala Bhavan, Swami Nityanand Road Andheri(E Mumbai Maharashtra : 400069 <BR>Phone: 91-022-66919187/67261007/66919189 <BR>Email: info@guficbio.com <BR>Website: http://www.gufic.com

View full answer

Who are the peers of the Gufic BioScience?

01-Sep-2026

Gufic BioScience's peers include Orchid Pharma, Morepen Labs, FDC, Guj. Themis Bio, RPG LifeScience, Unichem Labs, Aarti Drugs, Novartis India, SMS Pharma, and Zota Health Care. In terms of returns, Morepen Labs leads with 129.51% over one year, while Gufic BioScience has a return of 13.29%.

Peers: The peers of Gufic BioScience are Orchid Pharma, Morepen Labs., FDC, Guj. Themis Bio., RPG LifeScience., Unichem Labs., Aarti Drugs, Novartis India, SMS Pharma, and Zota Health Care.<BR><BR>Quality Snapshot: Excellent management risk is observed at Guj. Themis Bio. and Novartis India, while Average management risk is found at Orchid Pharma, Morepen Labs., FDC, RPG LifeScience., Unichem Labs., Gufic BioScience, Aarti Drugs, and SMS Pharma. Good growth is noted at Unichem Labs. and Novartis India, while Below Average growth is seen at Orchid Pharma, Morepen Labs., FDC, Guj. Themis Bio., RPG LifeScience., Gufic BioScience, Aarti Drugs, SMS Pharma, and Zota Health Care. Excellent capital structure is present at Morepen Labs., FDC, Guj. Themis Bio., RPG LifeScience., and Novartis India, while Good capital structure is found at Gufic BioScience, Aarti Drugs, and Unichem Labs., and Average capital structure is observed at SMS Pharma.<BR><BR>Return Snapshot: The peer with the highest 1-year return is Morepen Labs. at 129.51%, while the lowest is FDC at -26.41%. Gufic BioScience's 1-year return of 13.29% is higher than FDC's but lower than Morepen Labs. Additionally, Aarti Drugs is the only peer with a negative six-month return at -12.04%.

View full answer

How big is Gufic BioScience?

01-Sep-2026

As of 31st August, Gufic BioSciences Ltd has a market capitalization of 4,071.00 Cr, with recent Net Sales of 981.10 Cr and a Net Profit of 73.45 Cr. The company reported Shareholder's Funds of 664.95 Cr and Total Assets of 1,342.37 Cr for the latest annual period ending in March 2026.

As of 31st August, Gufic BioSciences Ltd has a market capitalization of 4,071.00 Cr, classifying it as a Small Cap company.<BR><BR>In the latest four quarters, Gufic BioSciences reported Net Sales of 981.10 Cr and a Net Profit of 73.45 Cr.<BR><BR>For the latest annual period ending in March 2026, the company had Shareholder's Funds amounting to 664.95 Cr and Total Assets of 1,342.37 Cr.

View full answer

Should I buy, sell or hold Gufic BioSciences Ltd?

16-Aug-2026

Are Gufic BioSciences Ltd latest results good or bad?

14-Aug-2026

Gufic BioSciences Ltd's Q4 FY26 results are strong, with a 183.68% increase in net profit and a 22.83% revenue growth. However, concerns about long-term profitability and stock performance relative to the market suggest a mixed outlook.

Gufic BioSciences Ltd's latest results for Q4 FY26 indicate a strong performance overall. The company reported a net profit of ₹21.90 crores, which represents a remarkable increase of 183.68% year-on-year. Revenue also grew by 22.83%, reaching ₹251.82 crores, with an operating margin of 18.75%, the highest in seven quarters. This margin improvement reflects better operational efficiency and cost management.<BR><BR>However, while these headline figures are impressive, there are underlying concerns. The stock has underperformed the broader market over the past year, declining 14.35% compared to the Sensex's 8.40% drop. This raises questions about the sustainability of the recent recovery, especially given the company's history of erratic profitability and declining capital returns.<BR><BR>In summary, while the latest results show strong quarterly performance, the overall outlook remains mixed due to concerns about long-term profitability and valuation. Investors should weigh these factors carefully.

View full answer

When is the next results date for Gufic BioSciences Ltd?

11-Aug-2026

The next results date for Gufic BioSciences Ltd is 14 August 2026.

The next results date for Gufic BioSciences Ltd is scheduled for 14 August 2026.

View full answer

Is Gufic BioScience overvalued or undervalued?

04-Dec-2025

As of December 3, 2025, Gufic BioScience is overvalued with a PE ratio of 61.64 and a Price to Book Value of 5.56, significantly higher than its peers, indicating that its current price of 349.85 is not justified given its low ROE of 9.02% and recent stock performance.

As of 3 December 2025, Gufic BioScience has moved from an expensive to a very expensive valuation grade. The company is currently overvalued, with a PE ratio of 61.64, a Price to Book Value of 5.56, and an EV to EBITDA of 28.83. In comparison to its peers, Sun Pharma has a PE ratio of 37.51 and an EV to EBITDA of 24.8, while Divi's Lab shows a PE ratio of 68.92, indicating that Gufic's valuation is significantly higher than some competitors.<BR><BR>Despite a recent stock return of -22.78% year-to-date compared to the Sensex's 8.92%, the valuation metrics suggest that Gufic BioScience is not justified at its current price of 349.85, especially when considering its low ROE of 9.02% and a PEG ratio of 0.00. Overall, the company's financial ratios and peer comparisons reinforce the conclusion that Gufic BioScience is overvalued in the current market environment.

View full answer

Is Gufic BioScience technically bullish or bearish?

24-Nov-2025

As of November 21, 2025, Gufic BioScience's trend is mildly bearish, indicated by bearish MACD and moving averages, while On-Balance Volume shows some bullish activity, suggesting mixed market sentiment.

As of 21 November 2025, the technical trend for Gufic BioScience has changed from bearish to mildly bearish. The current stance is mildly bearish, driven by several indicators. The MACD is bearish on the weekly chart and mildly bearish on the monthly chart, while the Bollinger Bands also reflect a mildly bearish sentiment in both time frames. Moving averages indicate a mildly bearish trend on the daily chart. KST is bearish weekly and mildly bearish monthly, and Dow Theory supports a mildly bearish outlook across both time frames. However, the On-Balance Volume (OBV) shows bullish signals on both weekly and monthly charts, indicating some buying pressure. Overall, the combination of these indicators suggests a mildly bearish sentiment with some underlying bullish activity.

View full answer

How has been the historical performance of Gufic BioScience?

17-Nov-2025

Gufic BioScience's historical performance for the fiscal year ending March 2025 shows increased net sales and improved cash flow, but decreased profitability with lower operating profit, profit before tax, and earnings per share compared to March 2024. Total assets and liabilities rose, indicating a stable financial position despite challenges in margins.

Answer:<BR>The historical performance of Gufic BioScience shows a mixed trend in its financial metrics for the fiscal year ending March 2025 compared to March 2024.<BR><BR>Breakdown:<BR>Gufic BioScience reported net sales of 819.81 Cr in March 2025, a slight increase from 806.67 Cr in March 2024. Total operating income also rose to 819.81 Cr from 806.67 Cr. However, total expenditure increased to 685.12 Cr from 660.79 Cr, leading to a decrease in operating profit (PBDIT) from 148.06 Cr to 138.32 Cr. Profit before tax fell to 94.14 Cr from 115.67 Cr, and profit after tax decreased to 69.65 Cr from 86.14 Cr, reflecting a decline in profitability. The earnings per share (EPS) also dropped from 8.59 to 6.94. On the balance sheet, total assets increased to 1,169.36 Cr from 1,092.54 Cr, while total liabilities rose to 1,169.36 Cr from 1,092.54 Cr, indicating a stable financial position. Cash flow from operating activities improved significantly to 122.00 Cr from a negative 7.00 Cr, contributing to a net cash inflow of 14.00 Cr compared to an outflow of 27.00 Cr in the previous year. Overall, while Gufic BioScience experienced growth in sales and cash flow from operations, it faced challenges in profitability and margins.

View full answer

Who are the top shareholders of the Gufic BioScience?

06-Jun-2025

The top shareholders of Gufic BioScience include promoter Jayesh Pannalal Choksi with 24.62%, public shareholder Motilal Oswal Financial Services Ltd at 3.32%, mutual funds with 3.39%, 21 Foreign Institutional Investors holding 0.31%, and individual investors collectively owning 15.15%.

The top shareholders of Gufic BioScience include the promoters, who hold the majority of the shares. The promoter with the highest holding is Jayesh Pannalal Choksi, owning 24.62% of the company. Additionally, Motilal Oswal Financial Services Ltd is the highest public shareholder, holding 3.32%. The company also has mutual funds involved through five schemes, which collectively hold 3.39%, and 21 Foreign Institutional Investors (FIIs) that hold 0.31%. Individual investors collectively own 15.15% of the shares.

View full answer

Has Gufic BioScience declared dividend?

06-Jun-2025

Yes, Gufic BioSciences Ltd has declared a 10% dividend, amounting to 0.1 per share, with an ex-date of September 17, 2024. The dividend yield is 0.03%, and while the company has shown significant long-term growth, it experienced a recent decline in price returns over the last six months.

Gufic BioSciences Ltd has declared a 10% dividend.<BR><BR>Dividend Details:<BR>- Percentage announced: 10%<BR>- Amount per share: 0.1<BR>- Ex-date: 17 Sep 24<BR><BR>Dividend Yield: 0.03%.<BR><BR>Total Returns by Period:<BR>In the last 6 months, the price return was -16.6%, with a dividend return of 0%, resulting in a total return of -16.6%.<BR><BR>Over the past year, the price return was 18.87%, the dividend return was 0.03%, leading to a total return of 18.9%.<BR><BR>In the two-year period, the price return was 89.23%, with a dividend return of 0.08%, giving a total return of 89.31%.<BR><BR>For the three-year period, the price return was 66.49%, the dividend return was 0.14%, resulting in a total return of 66.63%.<BR><BR>In the four-year timeframe, the price return was 94.44%, with a dividend return of 0.22%, culminating in a total return of 94.66%.<BR><BR>Finally, over five years, the price return was 479.22%, with a dividend return of 0.58%, resulting in a total return of 479.8%.<BR><BR>Overall, Gufic BioSciences has declared a dividend while experiencing varying total returns across different periods, with significant growth over the long term despite a recent decline in the short term. The dividend yield remains low, indicating that the company may be reinvesting profits for growth rather than distributing them as dividends.

View full answer
iScoreScore
Click here to find our call on this stock
Strong Sell
Sell
Hold
Buy
Strong Buy

Dashboard

1

Company has a Debt to Equity ratio (avg) of 0.50 times

 
2

Poor long term growth as Net Sales has grown by an annual rate of 7.79% and Operating profit at 4.37% over the last 5 years

 
3

Positive results in Jun 26

4

With ROCE of 12.1, it has a Very Expensive valuation with a 4.7 Enterprise value to Capital Employed

5

Majority shareholders : Promoters

 
6

Market Beating performance in long term as well as near term

stock-summaryMojo Parameters

Mojo Parameters

Loading Valuation Snapshot...

Stock DNA

stock-summary
Industry

Pharmaceuticals & Biotechnology

stock-summary
Market cap

INR 4,429 Cr (Small Cap)

stock-summary
P/E

59.00

stock-summary
Industry P/E

37

stock-summary
Dividend Yield

0.05%

stock-summary
Debt Equity

0.49

stock-summary
Return on Equity

9.66%

stock-summary
Price to Book

6.56

Revenue and Profits:
Net Sales:
261 Cr
(Quarterly Results - Jun 2026)
Net Profit:
22 Cr
stock-summaryTotal Returns
Total Returns (Price + Dividend) stock-summary
Dividend Yield (0.05%)
TimePeriod
Price Return
Dividend Return
Total Return
3 Months
24.06%
0.03%
24.09%
6 Months
49.94%
0.03%
49.97%
1 Year
19.54%
0.03%
19.57%
2 Years
8.87%
0.05%
8.92%
3 Years
54.26%
0.11%
54.37%
4 Years
92.9%
0.18%
93.08%
5 Years
125.16%
0.26%
125.42%

Latest dividend: 0.10035574092247301 per share ex-dividend date: Aug-28-2026

Risk Adjusted Returns v/s stock-summary
Returns Beta
Icon
Beta has not been calculated since enough price history is not available
stock-summaryNews & Corporate Actions

Announcements stock-summary

Announcement under Regulation 30 (LODR)-Credit Rating

08-Sep-2026 | Source : BSE

Intimation of Credit Rating is attached herewith

Shareholder Meeting / Postal Ballot-Scrutinizers Report

07-Sep-2026 | Source : BSE

Voting Results and Consolidated Scrutinizer Report of 42nd Annual General Meeting of the Company held on Friday September 04 2026 is attached herewith

Shareholder Meeting / Postal Ballot-Outcome of AGM

04-Sep-2026 | Source : BSE

Proceedings of the 42nd Annual General Meeting of the Company held on Friday September 04 2026 is attached herewith

Corporate Actions stock-summary

stock-summary
BOARD MEETING

No Upcoming Board Meetings

stock-summary
DIVIDEND

Gufic BioSciences Ltd has declared 10% dividend, ex-date: 28 Aug 26

stock-summary
SPLITS

No Splits history available

stock-summary
BONUS

No Bonus history available

stock-summary
RIGHTS

No Rights history available

stock-summaryKey Factors

Quality key factors stock-summary

Factor
Value
Sales Growth (5y)
7.79%
EBIT Growth (5y)
4.37%
EBIT to Interest (avg)
5.21
Debt to EBITDA (avg)
2.14
Net Debt to Equity (avg)
0.49
Sales to Capital Employed (avg)
1.33
Tax Ratio
26.04%
Dividend Payout Ratio
1.43%
Pledged Shares
0
Institutional Holding
4.14%
ROCE (avg)
20.50%
ROE (avg)
10.62%

Valuation key factors

Factor
Value
P/E Ratio
59
Industry P/E
37
Price to Book Value
6.56
EV to EBIT
35.05
EV to EBITDA
28.49
EV to Capital Employed
4.72
EV to Sales
4.78
PEG Ratio
2.93
Dividend Yield
0.05%
ROCE (Latest)
12.13%
ROE (Latest)
9.66%

Technicals key factors

Indicator
Weekly
Monthly
MACD
Bullish
Bullish
RSI
No Signal
No Signal
Bollinger Bands
Bullish
Bullish
Moving Averages
Bullish (Daily)
KST
Bullish
Mildly Bullish
Dow Theory
Mildly Bullish
Mildly Bullish
OBV
Bullish
Bullish
stock-summary Technical Indicator Scale: Bearish, Mildly Bearish, Sideways, Mildly Bullish, Bullish  Turned 
stock-summaryShareholding
Shareholding Snapshot : Jun 2026stock-summary
Shareholding Compare (%holding) stock-summary
Majority shareholders

Promoters

Pledged Promoter Holdings

None

Mutual Funds

Held by 5 Schemes (3.43%)

FIIs

Held by 25 FIIs (0.46%)

Promoter with highest holding

Jayesh Pannalal Choksi (24.62%)

Highest Public shareholder

Motilal Oswal Financial Services Ltd (3.32%)

Individual Investors Holdings

14.0%

stock-summaryFinancial
[
  {
    "link": "quarterly",
    "btn_text": "All Quarterly Results",
    "header": "Quarterly Results Snapshot (Consolidated) - Jun'26 - QoQ",
    "rhs": [
      {
        "prefix": "Net Sales ",
        "suffix": "QoQ Growth in quarter ended Jun 2026 is 3.57% vs 8.82% in Mar 2026",
        "dir": -1
      },
      {
        "prefix": "Consolidated Net Profit ",
        "suffix": "QoQ Growth in quarter ended Jun 2026 is 1.87% vs 76.33% in Mar 2026",
        "dir": -1
      }
    ],
    "table": {
      "header": [
        "Jun'26",
        "Mar'26",
        "Change(%)"
      ],
      "body": [
        {
          "field": "Net Sales",
          "val1": "260.82",
          "val2": "251.82",
          "chgp": "3.57%",
          "chgp_class": "positive"
        },
        {
          "field": "Operating Profit (PBDIT) excl Other Income",
          "val1": "46.61",
          "val2": "47.21",
          "chgp": "-1.27%",
          "chgp_class": "negative"
        },
        {
          "field": "Interest",
          "val1": "9.32",
          "val2": "9.44",
          "chgp": "-1.27%",
          "chgp_class": "positive"
        },
        {
          "field": "Exceptional Items",
          "val1": "0.00",
          "val2": "0.00",
          "chgp": "",
          "chgp_class": "neutral"
        },
        {
          "field": "Consolidate Net Profit",
          "val1": "22.31",
          "val2": "21.90",
          "chgp": "1.87%",
          "chgp_class": "positive"
        },
        {
          "field": "Operating Profit Margin (Excl OI)",
          "val1": "17.87%",
          "val2": "18.75%",
          "chgp": "-0.88%",
          "chgp_class": "negative"
        }
      ]
    }
  },
  {
    "link": "half-yearly",
    "btn_text": "All Half Yearly Results",
    "header": "Half Yearly Results Snapshot (Consolidated) - Sep'25",
    "rhs": [
      {
        "prefix": "Net Sales ",
        "suffix": " Growth in half year ended Sep 2025 is 13.22% vs -0.71% in Sep 2024",
        "dir": 1
      },
      {
        "prefix": "Consolidated Net Profit ",
        "suffix": " Growth in half year ended Sep 2025 is -29.87% vs -2.76% in Sep 2024",
        "dir": -1
      }
    ],
    "table": {
      "header": [
        "Sep'25",
        "Sep'24",
        "Change(%)"
      ],
      "body": [
        {
          "field": "Net Sales",
          "val1": "460.78",
          "val2": "406.99",
          "chgp": "13.22%",
          "chgp_class": "positive"
        },
        {
          "field": "Operating Profit (PBDIT) excl Other Income",
          "val1": "71.15",
          "val2": "74.39",
          "chgp": "-4.36%",
          "chgp_class": "negative"
        },
        {
          "field": "Interest",
          "val1": "18.82",
          "val2": "9.80",
          "chgp": "92.04%",
          "chgp_class": "negative"
        },
        {
          "field": "Exceptional Items",
          "val1": "0.00",
          "val2": "0.00",
          "chgp": "",
          "chgp_class": "neutral"
        },
        {
          "field": "Consolidate Net Profit",
          "val1": "29.89",
          "val2": "42.62",
          "chgp": "-29.87%",
          "chgp_class": "negative"
        },
        {
          "field": "Operating Profit Margin (Excl OI)",
          "val1": "15.44%",
          "val2": "18.28%",
          "chgp": "-2.84%",
          "chgp_class": "negative"
        }
      ]
    }
  },
  {
    "link": "nine-monthly",
    "btn_text": "All Nine Monthly Results",
    "header": "Nine Monthly Results Snapshot (Consolidated) - Dec'25",
    "rhs": [
      {
        "prefix": "Net Sales ",
        "suffix": "YoY Growth in nine months ended Dec 2025 is 12.59% vs 0.51% in Dec 2024",
        "dir": 1
      },
      {
        "prefix": "Consolidated Net Profit ",
        "suffix": "YoY Growth in nine months ended Dec 2025 is -31.68% vs -6.29% in Dec 2024",
        "dir": -1
      }
    ],
    "table": {
      "header": [
        "Dec'25",
        "Dec'24",
        "Change(%)"
      ],
      "body": [
        {
          "field": "Net Sales",
          "val1": "692.19",
          "val2": "614.78",
          "chgp": "12.59%",
          "chgp_class": "positive"
        },
        {
          "field": "Operating Profit (PBDIT) excl Other Income",
          "val1": "104.13",
          "val2": "108.31",
          "chgp": "-3.86%",
          "chgp_class": "negative"
        },
        {
          "field": "Interest",
          "val1": "27.18",
          "val2": "14.71",
          "chgp": "84.77%",
          "chgp_class": "negative"
        },
        {
          "field": "Exceptional Items",
          "val1": "0.00",
          "val2": "0.00",
          "chgp": "",
          "chgp_class": "neutral"
        },
        {
          "field": "Consolidate Net Profit",
          "val1": "42.31",
          "val2": "61.93",
          "chgp": "-31.68%",
          "chgp_class": "negative"
        },
        {
          "field": "Operating Profit Margin (Excl OI)",
          "val1": "15.04%",
          "val2": "17.62%",
          "chgp": "-2.58%",
          "chgp_class": "negative"
        }
      ]
    }
  },
  {
    "link": "annual",
    "btn_text": "All Annual Results",
    "header": "Annual Results Snapshot (Consolidated) - Mar'26",
    "rhs": [
      {
        "prefix": "Net Sales ",
        "suffix": "YoY Growth in year ended Mar 2026 is 15.15% vs 1.63% in Mar 2025",
        "dir": 1
      },
      {
        "prefix": "Consolidated Net Profit ",
        "suffix": "YoY Growth in year ended Mar 2026 is -7.81% vs -19.14% in Mar 2025",
        "dir": 1
      }
    ],
    "table": {
      "header": [
        "Mar'26",
        "Mar'25",
        "Change(%)"
      ],
      "body": [
        {
          "field": "Net Sales",
          "val1": "944.01",
          "val2": "819.81",
          "chgp": "15.15%",
          "chgp_class": "positive"
        },
        {
          "field": "Operating Profit (PBDIT) excl Other Income",
          "val1": "151.34",
          "val2": "136.10",
          "chgp": "11.20%",
          "chgp_class": "positive"
        },
        {
          "field": "Interest",
          "val1": "36.61",
          "val2": "24.52",
          "chgp": "49.31%",
          "chgp_class": "negative"
        },
        {
          "field": "Exceptional Items",
          "val1": "0.00",
          "val2": "0.00",
          "chgp": "",
          "chgp_class": "neutral"
        },
        {
          "field": "Consolidate Net Profit",
          "val1": "64.21",
          "val2": "69.65",
          "chgp": "-7.81%",
          "chgp_class": "negative"
        },
        {
          "field": "Operating Profit Margin (Excl OI)",
          "val1": "16.03%",
          "val2": "16.60%",
          "chgp": "-0.57%",
          "chgp_class": "negative"
        }
      ]
    }
  }
]

Quarterly Results Snapshot (Consolidated) - Jun'26 - QoQstock-summary

Jun'26
Mar'26
Change(%)
Net Sales
260.82
251.82
3.57%
Operating Profit (PBDIT) excl Other Income
46.61
47.21
-1.27%
Interest
9.32
9.44
-1.27%
Exceptional Items
0.00
0.00
Consolidate Net Profit
22.31
21.90
1.87%
Operating Profit Margin (Excl OI)
17.87%
18.75%
-0.88%
Values in Rs Cr.
Direction Arrows
Net Sales

QoQ Growth in quarter ended Jun 2026 is 3.57% vs 8.82% in Mar 2026

Direction Arrows
Consolidated Net Profit

QoQ Growth in quarter ended Jun 2026 is 1.87% vs 76.33% in Mar 2026

Half Yearly Results Snapshot (Consolidated) - Sep'25stock-summary

Sep'25
Sep'24
Change(%)
Net Sales
460.78
406.99
13.22%
Operating Profit (PBDIT) excl Other Income
71.15
74.39
-4.36%
Interest
18.82
9.80
92.04%
Exceptional Items
0.00
0.00
Consolidate Net Profit
29.89
42.62
-29.87%
Operating Profit Margin (Excl OI)
15.44%
18.28%
-2.84%
Values in Rs Cr.
Direction Arrows
Net Sales

Growth in half year ended Sep 2025 is 13.22% vs -0.71% in Sep 2024

Direction Arrows
Consolidated Net Profit

Growth in half year ended Sep 2025 is -29.87% vs -2.76% in Sep 2024

Nine Monthly Results Snapshot (Consolidated) - Dec'25stock-summary

Dec'25
Dec'24
Change(%)
Net Sales
692.19
614.78
12.59%
Operating Profit (PBDIT) excl Other Income
104.13
108.31
-3.86%
Interest
27.18
14.71
84.77%
Exceptional Items
0.00
0.00
Consolidate Net Profit
42.31
61.93
-31.68%
Operating Profit Margin (Excl OI)
15.04%
17.62%
-2.58%
Values in Rs Cr.
Direction Arrows
Net Sales

YoY Growth in nine months ended Dec 2025 is 12.59% vs 0.51% in Dec 2024

Direction Arrows
Consolidated Net Profit

YoY Growth in nine months ended Dec 2025 is -31.68% vs -6.29% in Dec 2024

Annual Results Snapshot (Consolidated) - Mar'26stock-summary

Mar'26
Mar'25
Change(%)
Net Sales
944.01
819.81
15.15%
Operating Profit (PBDIT) excl Other Income
151.34
136.10
11.20%
Interest
36.61
24.52
49.31%
Exceptional Items
0.00
0.00
Consolidate Net Profit
64.21
69.65
-7.81%
Operating Profit Margin (Excl OI)
16.03%
16.60%
-0.57%
Values in Rs Cr.
Direction Arrows
Net Sales

YoY Growth in year ended Mar 2026 is 15.15% vs 1.63% in Mar 2025

Direction Arrows
Consolidated Net Profit

YoY Growth in year ended Mar 2026 is -7.81% vs -19.14% in Mar 2025

stock-summaryCompany CV
About Gufic BioSciences Ltd stock-summary
stock-summary
Gufic BioSciences Ltd
Small Cap
Pharmaceuticals & Biotechnology
Gufic Biosciences Limited is a prominent global pharmaceutical enterprise dedicated to delivering a broad spectrum of pharmaceutical services to its clients. Renowned for its extensive range of pharmaceutical products, Gufic operates as a comprehensive solution provider in both domestic and international markets, supported by a robust distribution network. The Company is ranked among the top 100 pharmaceutical companies in India.
Company Coordinates stock-summary
Company Details
Shop-37 1st Flr Kamala Bhavan, Swami Nityanand Road Andheri(E Mumbai Maharashtra : 400069
stock-summary
Tel: 91-022-66919187/67261007/66919189
stock-summary
info@guficbio.com
Registrar Details
Link Intime India Pvt Ltd, C-13 Pannalal Silk Compound, L B S Marg, Bhandup , Mumbai