
Compare Capital Trust with Similar Stocks
Dashboard
Weak Long Term Fundamental Strength with an average Return on Equity (ROE) of 0.82%
- Poor long term growth as Net Sales has grown by an annual rate of -17.49% and Operating profit at -225.37%
The company has declared Negative results for the last 4 consecutive quarters
Risky - Negative EBITDA
Underperformed the market in the last 1 year
Stock DNA
Non Banking Financial Company (NBFC)
INR 44 Cr (Micro Cap)
NA (Loss Making)
21
0.00%
0.65
-76.14%
0.68
Total Returns (Price + Dividend) 
Latest dividend: 0.5 per share ex-dividend date: Sep-20-2019
Risk Adjusted Returns v/s
Returns Beta

News
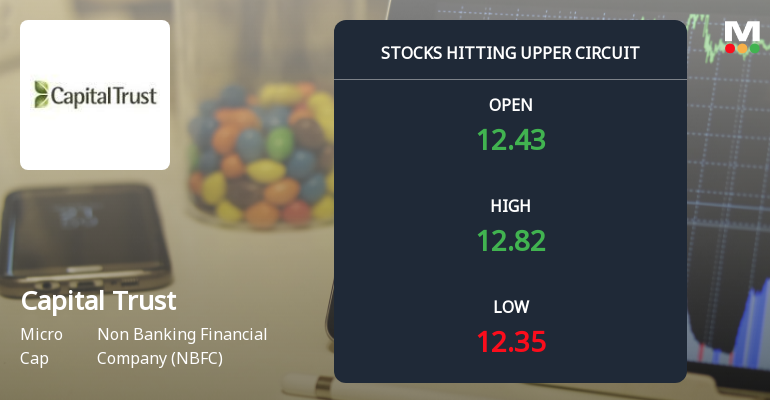
Capital Trust Ltd Locks at Upper Circuit With 4.87% Gain — Buyers Queue, Sellers Absent
At Rs 12.93, the buying was done — not because demand dried up, but because the exchange wouldn't let the stock go any higher. Capital Trust Ltd locked at its upper circuit of 4.87% on 25 Jun 2026, with buyers queuing and no sellers willing to part with shares.
Read full news article
Capital Trust Ltd is Rated Strong Sell
Capital Trust Ltd is rated Strong Sell by MarketsMOJO. This rating was last updated on 27 Nov 2024, reflecting a significant reassessment of the stock’s outlook. However, the analysis below is based on the company’s current position as of 18 June 2026, incorporating the latest fundamentals, returns, and financial metrics to provide investors with an up-to-date perspective.
Read full news article
Capital Trust Ltd Locks at Lower Circuit With 4.2% Loss — Sellers Queue, No Buyers in Sight
At Rs 12.45, sellers were still queuing — but there were no buyers willing to take the other side. Capital Trust Ltd locked at its lower circuit of 4.2% on 11 Jun 2026, with unfilled sell orders and a frozen price, reflecting persistent selling pressure in a micro-cap stock with limited liquidity.
Read full news article Announcements
Announcement under Regulation 30 (LODR)-Investor Presentation
31-May-2026 | Source : BSEPlease find attacched herewith investor presentation as for Q4 of FY 2025-26
Outcome Of Board Meeting Under Regulation 30 Of SEBI (Listing Obligations And Disclosure Requirements) Regulations 2015
27-May-2026 | Source : BSEResults for upload
Announcement under Regulation 30 (LODR)-Press Release / Media Release
27-May-2026 | Source : BSECapital Trust Limited gives press release on financial results of Q4 and Financial Year ended 31st March 2026
Corporate Actions

No Upcoming Board Meetings

Capital Trust Ltd has declared 5% dividend, ex-date: 20 Sep 19

No Splits history available

No Bonus history available

Capital Trust Ltd has announced 1:1 rights issue, ex-date: 10 Oct 25
Quality key factors
Valuation key factors
Technicals key factors
 Technical Indicator Scale: Bearish, Mildly Bearish, Sideways, Mildly Bullish, Bullish Turned
 Shareholding Snapshot : Mar 2026
Shareholding Compare (%holding)
Promoters
None
Held by 1 Schemes (0.0%)
Held by 0 FIIs
Yogen Khosla (36.96%)
India 2020 Ii Investors,limited (7.12%)
32.17%
Quarterly Results Snapshot (Standalone) - Dec'25 - YoY

YoY Growth in quarter ended Dec 2025 is -55.18% vs 30.27% in Dec 2024
YoY Growth in quarter ended Dec 2025 is -4,150.00% vs -89.09% in Dec 2024
Half Yearly Results Snapshot (Standalone) - Sep'25
Growth in half year ended Sep 2025 is -57.48% vs 35.18% in Sep 2024
Growth in half year ended Sep 2025 is -2,802.06% vs -2.02% in Sep 2024
Nine Monthly Results Snapshot (Standalone) - Dec'25
YoY Growth in nine months ended Dec 2025 is -56.71% vs 33.50% in Dec 2024
YoY Growth in nine months ended Dec 2025 is -2,880.58% vs -33.12% in Dec 2024
Annual Results Snapshot (Standalone) - Mar'26
YoY Growth in year ended Mar 2026 is -56.15% vs 21.96% in Mar 2025
YoY Growth in year ended Mar 2026 is -4,318.02% vs -48.37% in Mar 2025
About Capital Trust Ltd

Company Coordinates


