
Compare Manraj Hsg.Fin. with Similar Stocks
Stock DNA
Housing Finance Company
INR 22 Cr (Micro Cap)
NA (Loss Making)
14
0.00%
-19.93
47.00%
-22.30
Total Returns (Price + Dividend) 
Manraj Hsg.Fin. for the last several years.
Risk Adjusted Returns v/s
Returns Beta

News

Manraj Housing Finance Ltd Falls to 52-Week Low of Rs 31.4 as Sell-Off Deepens
For the second consecutive session, Manraj Housing Finance Ltd has seen its share price decline, hitting a fresh 52-week low of Rs 31.4 on 23 Apr 2026. This latest drop extends the stock’s downward trajectory, which has now resulted in a 7.86% loss over the past two days, underscoring persistent selling pressure despite broader market fluctuations.
Read full news article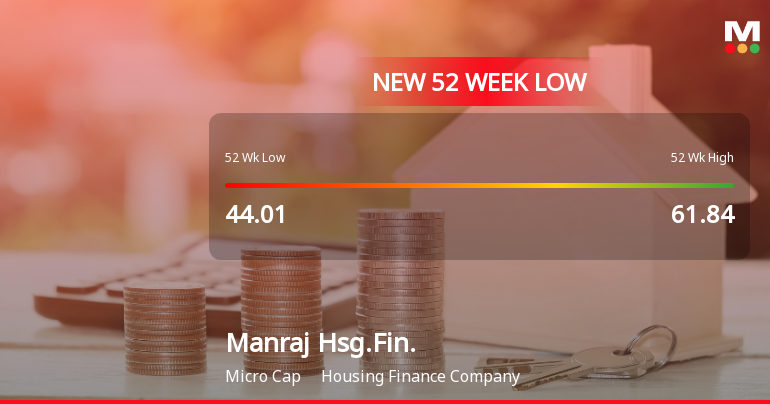
Manraj Housing Finance Ltd Falls to 52-Week Low of Rs 32.4 as Sell-Off Deepens
A sharp decline of 4.93% today dragged Manraj Housing Finance Ltd to a fresh 52-week low of Rs 32.4, extending a downward trend that has seen the stock lose over 41% in the past year despite a broadly resilient market backdrop.
Read full news article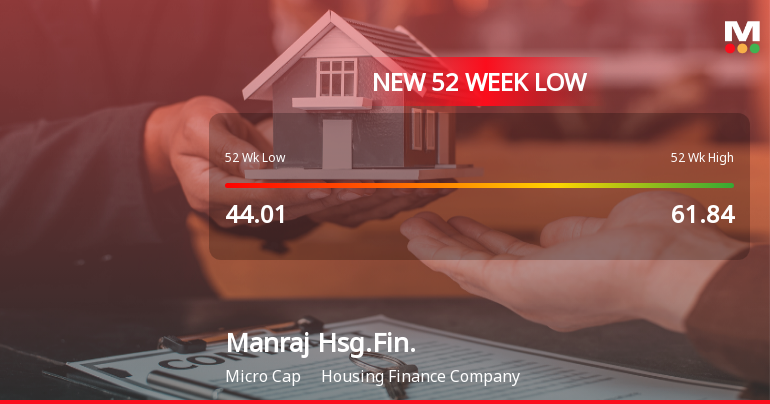
Announcements
Compliances-Certificate under Reg. 74 (5) of SEBI (DP) Regulations 2018
11-Apr-2026 | Source : BSESubmission of certificate under regulations 74 (5) of SEBI (DP) Regulations 2018
Closure of Trading Window
25-Mar-2026 | Source : BSEIntimation of closure of Trading Window in term of SEBI (Prohibition of Insider Trading) Regulations 2015. The Trading Window for Dealing in Securities shall be closed with effect from 01st April 2026 for the designated person and their immediate relatives till Forty Eight hours after declaration of Unaudited Financial Results for the Quarter and Year ended 31st March 2026.
Announcement under Regulation 30 (LODR)-Newspaper Publication
31-Jan-2026 | Source : BSESubmission of Newspaper Publication of Unaudited Financial Results for the Quarter and Nine Months Ended 31st December 2025.
Corporate Actions

No Upcoming Board Meetings

No Dividend history available

No Splits history available

No Bonus history available

No Rights history available
Quality key factors
Valuation key factors
Technicals key factors
 Technical Indicator Scale: Bearish, Mildly Bearish, Sideways, Mildly Bullish, Bullish Turned
 Shareholding Snapshot : Mar 2026
Shareholding Compare (%holding)
Promoters
None
Held by 0 Schemes
Held by 0 FIIs
Ishwarlal S Jain (12.91%)
Pukhraj Prithviraj Jain (4.7%)
29.94%
Quarterly Results Snapshot (Standalone) - Dec'25 - QoQ
QoQ Growth in quarter ended Dec 2025 is 0.00% vs 0.00% in Sep 2025

QoQ Growth in quarter ended Dec 2025 is -25.00% vs 88.24% in Sep 2025
Half Yearly Results Snapshot (Standalone) - Sep'25
Growth in half year ended Sep 2025 is 0.00% vs 0.00% in Sep 2024
Growth in half year ended Sep 2025 is -192.86% vs 940.00% in Sep 2024
Nine Monthly Results Snapshot (Standalone) - Dec'25
YoY Growth in nine months ended Dec 2025 is 0.00% vs 0.00% in Dec 2024
YoY Growth in nine months ended Dec 2025 is -215.79% vs 642.86% in Dec 2024
Annual Results Snapshot (Standalone) - Mar'25

YoY Growth in year ended Mar 2025 is 0.00% vs -100.00% in Mar 2024
YoY Growth in year ended Mar 2025 is 409.09% vs 15.38% in Mar 2024
About Manraj Housing Finance Ltd


