
Compare 3i Infotech with Similar Stocks
Dashboard
With a Operating Losses, the company has a Weak Long Term Fundamental Strength
- Company's ability to service its debt is weak with a poor EBIT to Interest (avg) ratio of -3.43
- The company has been able to generate a Return on Equity (avg) of 3.91% signifying low profitability per unit of shareholders funds
Negative results in Mar 26
Risky - Negative EBITDA
Consistent Underperformance against the benchmark over the last 3 years
Stock DNA
Computers - Software & Consulting
INR 360 Cr (Micro Cap)
9.00
20
0.00%
-0.04
10.20%
0.94
Total Returns (Price + Dividend) 
Latest dividend: 1.5 per share ex-dividend date: Jul-07-2011
Risk Adjusted Returns v/s
Returns Beta

News

3i Infotech Ltd Upgraded to Sell on Technical Improvements Despite Weak Fundamentals
3i Infotech Ltd, a micro-cap player in the Computers - Software & Consulting sector, has seen its investment rating upgraded from Strong Sell to Sell as of 19 June 2026. This change is primarily driven by a shift in technical indicators, even as the company continues to grapple with weak financial fundamentals and underperformance against market benchmarks.
Read full news article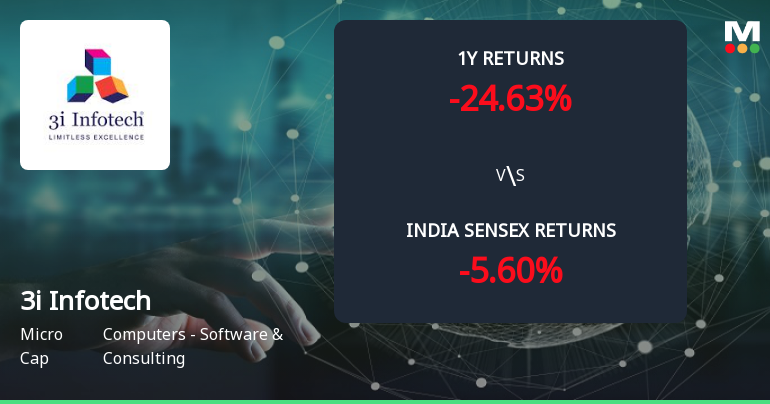
Golden Cross Forms in 3i Infotech Ltd — On a Day the Stock Fell 0.17%. What the Mixed Signals Mean
The 50-day moving average has crossed above the 200-day moving average for 3i Infotech Ltd, signalling a golden cross on 19 Jun 2026. Yet, the stock slipped 0.17% on the day the cross formed, while monthly technical indicators remain mixed. This divergence between the moving averages and price action calls for a deeper examination of the signal’s reliability.
Read full news article
3i Infotech Ltd is Rated Strong Sell
3i Infotech Ltd is rated Strong Sell by MarketsMOJO. This rating was last updated on 13 Nov 2025, reflecting a significant reassessment of the stock’s outlook. However, the analysis and financial metrics discussed here represent the company’s current position as of 11 June 2026, providing investors with the latest insights into its performance and prospects.
Read full news article Announcements
Announcement under Regulation 30 (LODR)-Award_of_Order_Receipt_of_Order
21-Jun-2026 | Source : BSEPlease find attached Intimation letter that Company has received an Order from a leading UAE-based technology Company Under SEBI Regulation 2015.
Announcement under Regulation 30 (LODR)-Award_of_Order_Receipt_of_Order
18-Jun-2026 | Source : BSEPlease find attached Intimation letter that Company has received an Order from National Commodity & Derivatives Exchange Limited (NCDEX) under Regulation 30 of SEBI Listing Regulations 2015.
Announcement under Regulation 30 (LODR)-Award_of_Order_Receipt_of_Order
10-Jun-2026 | Source : BSEPlease find attached Intimation letter that Company has received an Order from Hindustan Petroleum Corporation Limited (HPCL) under Regulation 30 of SEBI LODR Regulation 2015.
Corporate Actions

No Upcoming Board Meetings

3i Infotech Ltd has declared 15% dividend, ex-date: 07 Jul 11

No Splits history available

3i Infotech Ltd has announced 1:1 bonus issue, ex-date: 27 Aug 07

3i Infotech Ltd has announced 2:9 rights issue, ex-date: 26 Sep 25
Quality key factors
Valuation key factors
Technicals key factors
 Technical Indicator Scale: Bearish, Mildly Bearish, Sideways, Mildly Bullish, Bullish Turned
 Shareholding Snapshot : Mar 2026
Shareholding Compare (%holding)
Non Institution
None
Held by 0 Schemes
Held by 15 FIIs (0.31%)
None
Srei Multiple Asset Investment Trust - Vision India Fund (8.51%)
71.18%
Quarterly Results Snapshot (Consolidated) - Mar'26 - QoQ

QoQ Growth in quarter ended Mar 2026 is 2.11% vs -1.57% in Dec 2025
QoQ Growth in quarter ended Mar 2026 is 239.72% vs -88.39% in Dec 2025
Half Yearly Results Snapshot (Consolidated) - Sep'25
Growth in half year ended Sep 2025 is -3.33% vs -11.69% in Sep 2024
Growth in half year ended Sep 2025 is 238.49% vs 88.92% in Sep 2024
Nine Monthly Results Snapshot (Consolidated) - Dec'25
YoY Growth in nine months ended Dec 2025 is -3.93% vs -12.66% in Dec 2024
YoY Growth in nine months ended Dec 2025 is 1,918.71% vs 99.22% in Dec 2024
Annual Results Snapshot (Consolidated) - Mar'26
YoY Growth in year ended Mar 2026 is -4.46% vs -10.83% in Mar 2025

YoY Growth in year ended Mar 2026 is 39.88% vs 108.08% in Mar 2025
About 3i Infotech Ltd

Company Coordinates


