
Compare Punjab Chemicals with Similar Stocks
Dashboard
Poor long term growth as Net Sales has grown by an annual rate of 8.71% and Operating profit at 2.00% over the last 5 years
Flat results in Mar 26
Despite the size of the company, domestic mutual funds hold only 0.01% of the company
Below par performance in long term as well as near term
Stock DNA
Pesticides & Agrochemicals
INR 1,300 Cr (Micro Cap)
20.00
29
0.30%
0.33
15.47%
2.93
Total Returns (Price + Dividend) 
Latest dividend: 3 per share ex-dividend date: Jul-18-2025
Risk Adjusted Returns v/s
Returns Beta

News
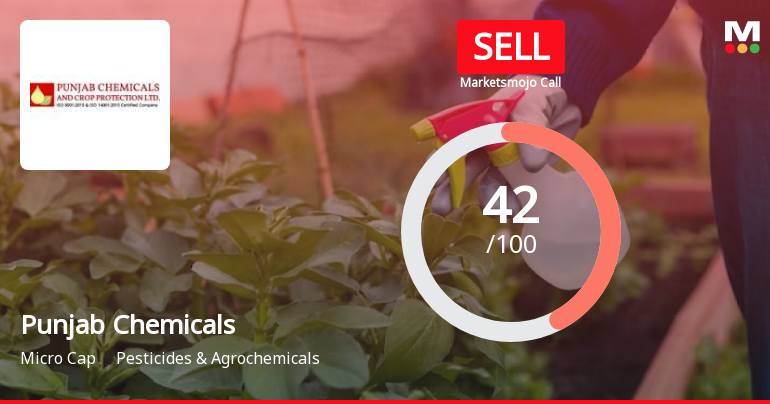
Punjab Chemicals & Crop Protection Ltd is Rated Sell
Punjab Chemicals & Crop Protection Ltd is rated 'Sell' by MarketsMOJO. This rating was last updated on 04 May 2026. However, the analysis and financial metrics discussed here reflect the company’s current position as of 20 June 2026, providing investors with the most recent and relevant data to assess the stock’s outlook.
Read full news article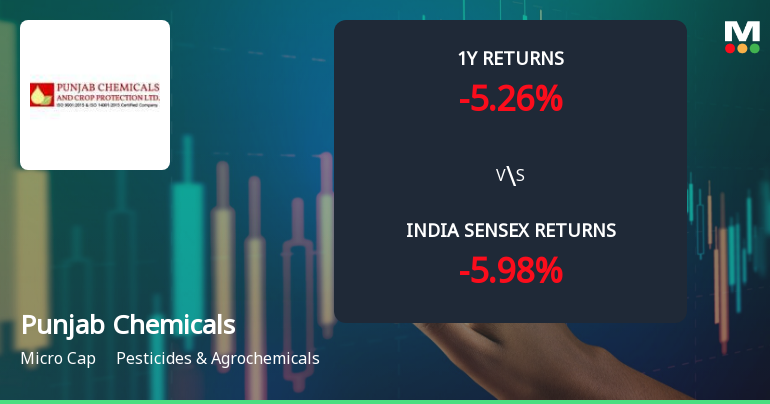
Punjab Chemicals & Crop Protection Ltd Sees Mixed Technical Signals Amid Mild Momentum Shift
Punjab Chemicals & Crop Protection Ltd has experienced a notable shift in its technical parameters, reflecting a complex interplay of bullish and bearish signals. Despite a recent 3.07% rise in the stock price to ₹1,035.55, the micro-cap company’s overall technical outlook remains cautiously bearish, with key indicators suggesting a nuanced momentum change in the pesticides and agrochemicals sector.
Read full news article
Punjab Chemicals & Crop Protection Ltd is Rated Sell
Punjab Chemicals & Crop Protection Ltd is rated 'Sell' by MarketsMOJO. This rating was last updated on 04 May 2026. However, the analysis and financial metrics discussed below reflect the stock's current position as of 09 June 2026, providing investors with an up-to-date view of the company’s fundamentals, returns, and market performance.
Read full news article Announcements
Communication To Shareholders - Deduction Of Tax At Source On Dividend
12-Jun-2026 | Source : BSECommunication to shareholders on deduction of tax at source on dividend is enclosed herewith
Announcement under Regulation 30 (LODR)-Analyst / Investor Meet - Intimation
11-Jun-2026 | Source : BSEAnalyst/Institutional Investor Meet scheduled to be held on Wednesday June 17 2026
Announcement under Regulation 30 (LODR)-Analyst / Investor Meet - Intimation
11-Jun-2026 | Source : BSEAnalyst/Institutional Investor Meet scheduled to be held on Tuesday June 16 2026
Corporate Actions

No Upcoming Board Meetings

Punjab Chemicals & Crop Protection Ltd has declared 30% dividend, ex-date: 18 Jul 25

No Splits history available

No Bonus history available

No Rights history available
Quality key factors
Valuation key factors
Technicals key factors
 Technical Indicator Scale: Bearish, Mildly Bearish, Sideways, Mildly Bullish, Bullish Turned
 Shareholding Snapshot : Mar 2026
Shareholding Compare (%holding)
Non Institution
None
Held by 3 Schemes (0.01%)
Held by 6 FIIs (3.01%)
Hemsil Trading And Manufacturing Pvt. Ltd. (32.76%)
Gowal Consulting Services Private Limited (24.47%)
20.04%
Quarterly Results Snapshot (Consolidated) - Mar'26 - QoQ

QoQ Growth in quarter ended Mar 2026 is -15.42% vs -3.37% in Dec 2025

QoQ Growth in quarter ended Mar 2026 is -20.49% vs -25.51% in Dec 2025
Half Yearly Results Snapshot (Consolidated) - Sep'25
Growth in half year ended Sep 2025 is 18.65% vs -7.49% in Sep 2024
Growth in half year ended Sep 2025 is 51.76% vs -35.44% in Sep 2024
Nine Monthly Results Snapshot (Consolidated) - Dec'25
YoY Growth in nine months ended Dec 2025 is 17.62% vs -5.35% in Dec 2024
YoY Growth in nine months ended Dec 2025 is 66.19% vs -37.71% in Dec 2024
Annual Results Snapshot (Consolidated) - Mar'26
YoY Growth in year ended Mar 2026 is 14.36% vs -3.61% in Mar 2025
YoY Growth in year ended Mar 2026 is 64.29% vs -27.34% in Mar 2025
About Punjab Chemicals & Crop Protection Ltd

Company Coordinates


