
Compare California Soft. with Similar Stocks
Dashboard
High Management Efficiency with a high ROCE of 17.56%
Healthy long term growth as Net Sales has grown by an annual rate of 68.21% and Operating profit at 72.04%
With a growth in Net Profit of 2966.67%, the company declared Outstanding results in Mar 26
With ROE of 25.8, it has a Very Attractive valuation with a 1.5 Price to Book Value
Majority shareholders : Promoters
Stock DNA
Computers - Software & Consulting
INR 57 Cr (Micro Cap)
6.00
20
0.00%
-0.11
25.75%
1.50
Total Returns (Price + Dividend) 
Latest dividend: 1.17 per share ex-dividend date: Sep-09-2010
Risk Adjusted Returns v/s
Returns Beta

News

California Software Company Ltd Locks at Lower Circuit With 4.35% Loss — Sellers Queue, No Buyers in Sight
At Rs 24.01, sellers were still queuing — but there were no buyers willing to take the other side. California Software Company Ltd locked at its lower circuit of 5% on 24 Jun 2026, with unfilled sell orders and a frozen price.
Read full news article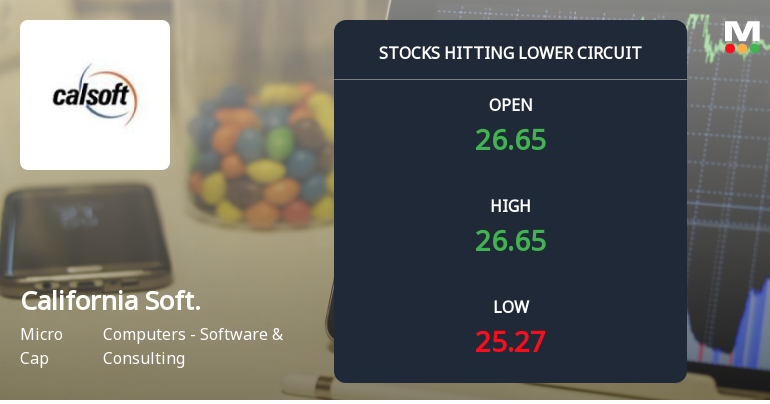
California Software Company Ltd Locks at Lower Circuit With 4.7% Loss — Sellers Queue, No Buyers in Sight
At Rs 25.34, sellers were still queuing — but there were no buyers willing to take the other side. California Software Company Ltd locked at its lower circuit of 4.7% on 23 Jun 2026, with unfilled sell orders and a frozen price.
Read full news article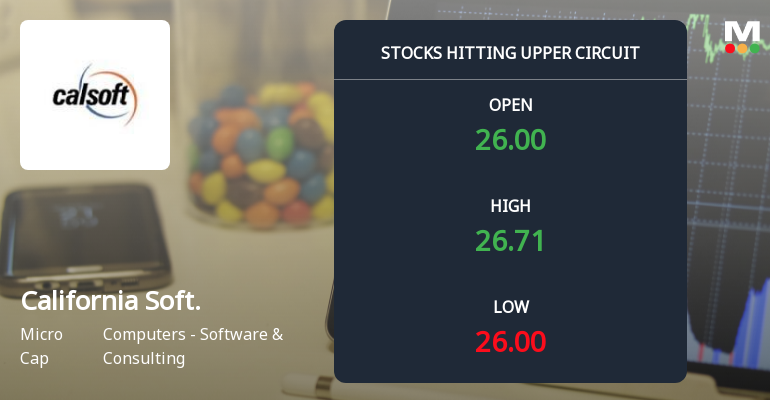
California Software Company Ltd Locks at Upper Circuit With 5% Gain — Buyers Queue, Sellers Absent
At Rs 26.7, the buying was done — not because demand dried up, but because the exchange wouldn't let the stock go any higher. California Software Company Ltd locked at its upper circuit of 4.99% on 22 Jun 2026, with buyers queuing and no sellers willing to part with shares.
Read full news article Announcements
Board Meeting Outcome for Outcome Of Board Meeting Held On June 18 2026 Under Regulation 30 Of SEBI (LODR) Regulations 2015
18-Jun-2026 | Source : BSEPursuant to Regulation 30 of the SEBI (LODR) Regulations 2015 California Software Company Limited informs that its Board of Directors at the meeting held on 18 June 2026 approved in principle the proposal to explore acquisition of up to 51% equity stake in Tech Aggregators Private Limited (Cashter) Chennai subject to due diligence valuation negotiations definitive agreements and regulatory approvals. The Board also approved execution of an MoU initiation of due diligence appointment of advisors and authorization of officers to undertake necessary actions. The proposed transaction is preliminary non-binding and subject to requisite approvals. The meeting commenced at 5:00 PM IST and concluded at 6:30 PM IST.
Board Meeting Intimation for Intimation Of Board Meeting Under Regulation 29 Of SEBI (Listing Obligations And Disclosure Requirements) Regulations 2015
17-Jun-2026 | Source : BSECalifornia Software Company Ltdhas informed BSE that the meeting of the Board of Directors of the Company is scheduled on 18/06/2026 inter alia to consider and approve Pursuant to Regulation 29 of the SEBI (Listing Obligations and Disclosure Requirements) Regulations 2015 we hereby inform that a Meeting of the Board of Directors of California Software Company Limited is scheduled to be held at 11:00 A.M. (IST) through Video Conferencing/Other Audio Visual Means to consider inter alia: 1. Acquisition of up to 51% equity stake in Tech Aggregators Private Limited (Cashter) Chennai subject to due diligence valuation regulatory approvals and definitive agreements. 2. Execution of a Memorandum of Understanding (MoU) with Cashter. 3. Conduct of legal financial tax technical and commercial due diligence. 4. Appointment of valuers legal advisors consultants and other professionals. 5. Authorization of the Managing Director and Key Managerial Personnel to finalize transaction-related documents. 6. Other incidental matters. Kindly take the above on record.
Board Meeting Outcome for Outcome Of Board Meeting Held On 28 May 2026
28-May-2026 | Source : BSEDear Sir/Madam Pursuant to Regulation 30 of the SEBI (LODR) Regulations 2015 we wish to inform you that the Board of Directors of California Software Company Limited at its meeting held on 27 May 2026 has inter alia approved the following: Redemption of 418700 OCRPS held by Chemoil Advanced MGMT Services Private Limited aggregating to ?41870000. Payment of ?41870000 towards redemption of the aforesaid OCRPS and cancellation thereof upon completion of formalities. Extension of time by one month for payment of the First and Final Call Money in respect of partly paid-up equity shares issued pursuant to the Rights Issue. Approval for forfeiture of partly paid-up equity shares in case of non-payment of call money within the extended period in accordance with applicable laws and terms of issue. Authorization to Directors and Officers to complete all necessary acts deeds and filings in this regard. Kindly take the same on record.
Corporate Actions

No Upcoming Board Meetings

California Software Company Ltd has declared 20% dividend, ex-date: 09 Sep 10

No Splits history available

No Bonus history available

California Software Company Ltd has announced 3:1 rights issue, ex-date: 15 Jan 25
Quality key factors
Valuation key factors
Technicals key factors
 Technical Indicator Scale: Bearish, Mildly Bearish, Sideways, Mildly Bullish, Bullish Turned
 Shareholding Snapshot : Mar 2026
Shareholding Compare (%holding)
Promoters
None
Held by 1 Schemes (0.0%)
Held by 0 FIIs
Vasudevan M (62.26%)
Gunjan Chhajer (2.29%)
34.53%
Quarterly Results Snapshot (Consolidated) - Mar'26 - YoY

YoY Growth in quarter ended Mar 2026 is 605.03% vs 97.03% in Mar 2025
YoY Growth in quarter ended Mar 2026 is 2,966.67% vs 100.00% in Mar 2025
Half Yearly Results Snapshot (Consolidated) - Sep'25
Growth in half year ended Sep 2025 is 43.72% vs 6.44% in Sep 2024
Growth in half year ended Sep 2025 is 68.00% vs 0.00% in Sep 2024
Nine Monthly Results Snapshot (Consolidated) - Dec'25
YoY Growth in nine months ended Dec 2025 is 62.72% vs 5.49% in Dec 2024
YoY Growth in nine months ended Dec 2025 is 217.78% vs -4.26% in Dec 2024
Annual Results Snapshot (Consolidated) - Mar'26
YoY Growth in year ended Mar 2026 is 260.73% vs 27.34% in Mar 2025
YoY Growth in year ended Mar 2026 is 1,376.39% vs 16.13% in Mar 2025
About California Software Company Ltd

Company Coordinates


