
Compare Link Pharma Chem with Similar Stocks
Dashboard
With a Operating Losses, the company has a Weak Long Term Fundamental Strength
- Company's ability to service its debt is weak with a poor EBIT to Interest (avg) ratio of 0.49
- The company has been able to generate a Return on Equity (avg) of 4.94% signifying low profitability per unit of shareholders funds
Flat results in Mar 26
Consistent Underperformance against the benchmark over the last 3 years
Stock DNA
Commodity Chemicals
INR 13 Cr (Micro Cap)
155.00
44
0.00%
0.50
0.61%
0.95
Total Returns (Price + Dividend) 
Link Pharma Chem for the last several years.
Risk Adjusted Returns v/s
Returns Beta

News
Link Pharma Chem Ltd Downgraded to Strong Sell Amid Mixed Technicals and Weak Financials
Link Pharma Chem Ltd, a micro-cap player in the commodity chemicals sector, has seen its investment rating upgraded from Sell to Strong Sell as of 29 June 2026. This change reflects nuanced shifts across four key parameters: quality, valuation, financial trend, and technical indicators. Despite persistent fundamental challenges, recent technical improvements and valuation adjustments have influenced the revised outlook.
Read full news article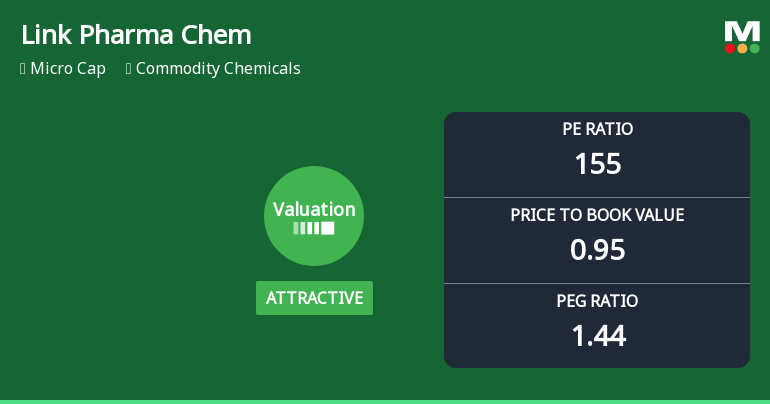
Link Pharma Chem Ltd Valuation Shifts Signal Renewed Price Attractiveness Amid Mixed Financials
Link Pharma Chem Ltd, a micro-cap player in the commodity chemicals sector, has witnessed a notable shift in its valuation parameters, moving from a very attractive to an attractive price level. Despite a challenging financial performance and a strong sell mojo grade, the stock’s price-to-earnings (P/E) and price-to-book value (P/BV) ratios suggest a nuanced investment case that merits close examination.
Read full news article
Link Pharma Chem Ltd Upgraded to Sell on Technical Improvements Despite Weak Fundamentals
Link Pharma Chem Ltd, a micro-cap player in the commodity chemicals sector, has seen its investment rating upgraded from Strong Sell to Sell as of 22 June 2026. This change reflects a nuanced shift in the company’s technical outlook amid persistent fundamental challenges and valuation considerations. The upgrade is primarily driven by improvements in technical indicators, while financial trends and quality metrics continue to weigh on investor sentiment.
Read full news article Announcements
Closure of Trading Window
26-Jun-2026 | Source : BSEIntimation for Closure of Trading Window Period.
Announcement under Regulation 30 (LODR)-Newspaper Publication
23-May-2026 | Source : BSENewspaper Publication of Audited Financial Result of the Company for the Quarter and year ended 31st March 2026. Published on 23rd May 2026 in Business Standard (English Edition) and Loksatta (Gujarati Edition).
Non Applicability Of Regulations 23(9) Of SEBI (LODR) Regulations 2015 On Disclosure Of Related Party Transactions For The Half Year Ended On 31St March 2026.
21-May-2026 | Source : BSENon Applicability of Regulations 23(9) of SEBI (LODR) Regulations 2015 on Disclosure of Non Applicability of reporting of Related Party Transactions for the Half year ended on 31st March 2026.
Corporate Actions

No Upcoming Board Meetings

No Dividend history available

No Splits history available

No Bonus history available

No Rights history available
Quality key factors
Valuation key factors
Technicals key factors
 Technical Indicator Scale: Bearish, Mildly Bearish, Sideways, Mildly Bullish, Bullish Turned
 Shareholding Snapshot : Mar 2026
Shareholding Compare (%holding)
Promoters
None
Held by 1 Schemes (0.02%)
Held by 0 FIIs
Rishikesh Satishbhai Thakur (21.95%)
Gurudev Marketing Pvt. Ltd. (5.76%)
36.12%
Quarterly Results Snapshot (Standalone) - Mar'26 - QoQ

QoQ Growth in quarter ended Mar 2026 is -2.08% vs 7.00% in Dec 2025
QoQ Growth in quarter ended Mar 2026 is -685.71% vs 250.00% in Dec 2025
Half Yearly Results Snapshot (Standalone) - Sep'25

Growth in half year ended Sep 2025 is 3.45% vs -2.08% in Sep 2024
Growth in half year ended Sep 2025 is 4,300.00% vs 99.46% in Sep 2024
Nine Monthly Results Snapshot (Standalone) - Dec'25
YoY Growth in nine months ended Dec 2025 is 9.80% vs -13.21% in Dec 2024
YoY Growth in nine months ended Dec 2025 is 172.06% vs 58.02% in Dec 2024
Annual Results Snapshot (Standalone) - Mar'26
YoY Growth in year ended Mar 2026 is 7.86% vs -14.95% in Mar 2025
YoY Growth in year ended Mar 2026 is 107.77% vs 24.26% in Mar 2025
About Link Pharma Chem Ltd

Company Coordinates


