
Compare Havells India with Similar Stocks
Stock DNA
Electronics & Appliances
INR 76,211 Cr (Mid Cap)
46.00
46
0.83%
-0.22
18.23%
8.00
Total Returns (Price + Dividend) 
Latest dividend: 6.007005838198499 per share ex-dividend date: May-22-2026
Risk Adjusted Returns v/s
Returns Beta

News
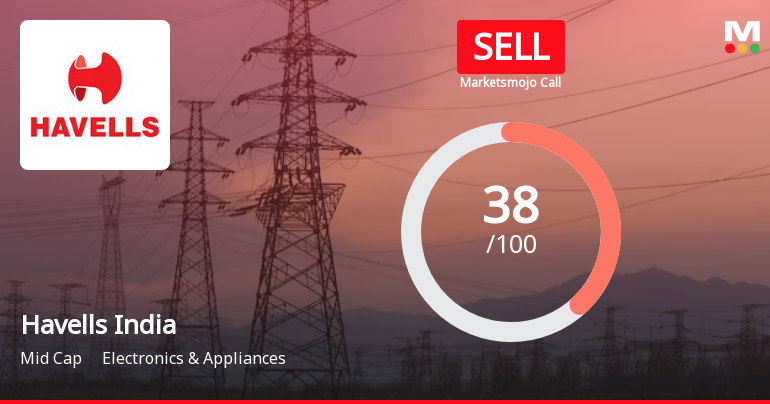
Havells India Ltd. is Rated Sell
Havells India Ltd. is rated Sell by MarketsMOJO, with this rating last updated on 14 July 2026. While the rating was revised on that date, the analysis and financial metrics presented here reflect the stock's current position as of 26 July 2026, providing investors with an up-to-date view of the company’s fundamentals, returns, and market performance.
Read full news article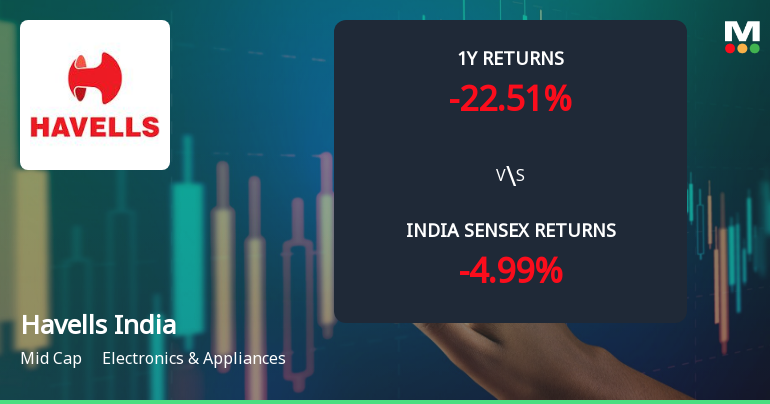
Havells India Ltd. Technical Momentum Shifts Amid Mixed Indicator Signals
Havells India Ltd., a prominent player in the Electronics & Appliances sector, has experienced a nuanced shift in its technical momentum, reflecting a complex interplay of bullish and bearish signals across key indicators. Despite a modest day gain of 1.43%, the stock’s broader trend remains cautiously bearish, prompting a recent downgrade in its Mojo Grade from Hold to Sell.
Read full news article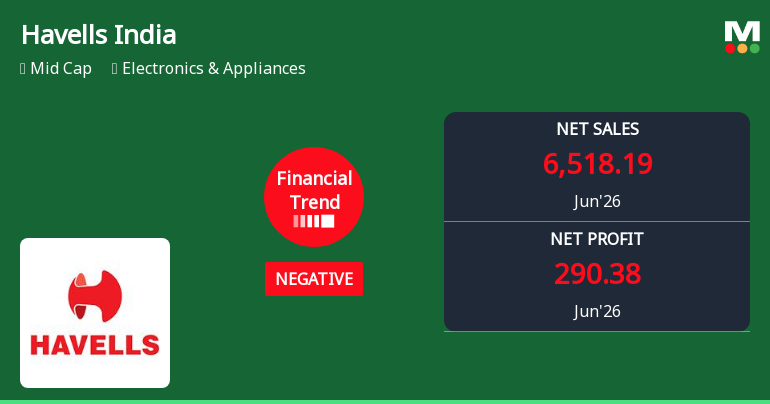
Havells India Ltd. Reports Sharp Decline in Quarterly Performance Amid Negative Financial Trend
Havells India Ltd., a prominent player in the Electronics & Appliances sector, has reported a marked deterioration in its financial performance for the quarter ended June 2026. The company’s recent quarterly results reveal a sharp contraction in profitability and operating margins, signalling a shift from its previously positive growth trajectory. This downturn comes amid broader market challenges and intensifying competition, raising concerns about Havells’ near-term outlook.
Read full news article Announcements
Announcement under Regulation 30 (LODR)-Newspaper Publication
24-Jul-2026 | Source : BSENewspaper Publication titled Special Window for Transfer and Dematerialisation of Physical Shares.
Announcement under Regulation 30 (LODR)-Earnings Call Transcript
21-Jul-2026 | Source : BSETranscript of the Earnings Call held on 17th July 2026 to discuss the financial results of the Company for the first quarter ended 30th June 2026.
Announcement under Regulation 30 (LODR)-Newspaper Publication
18-Jul-2026 | Source : BSENewspaper Publication of Q1 FY 2026-27 Unaudited Financial Results
Corporate Actions

No Upcoming Board Meetings

Havells India Ltd. has declared 600% dividend, ex-date: 22 May 26

Havells India Ltd. has announced 1:5 stock split, ex-date: 26 Aug 14

Havells India Ltd. has announced 1:1 bonus issue, ex-date: 08 Oct 10

No Rights history available
Quality key factors
Valuation key factors
Technicals key factors
 Technical Indicator Scale: Bearish, Mildly Bearish, Sideways, Mildly Bullish, Bullish Turned
 Shareholding Snapshot : Jun 2026
Shareholding Compare (%holding)
Promoters
None
Held by 37 Schemes (7.86%)
Held by 646 FIIs (15.91%)
Qrg Investments And Holdings Limited (41.23%)
Life Insurance Corporation Of India (7.65%)
5.31%
Quarterly Results Snapshot (Consolidated) - Jun'26 - QoQ

QoQ Growth in quarter ended Jun 2026 is -2.79% vs 20.00% in Mar 2026
QoQ Growth in quarter ended Jun 2026 is -59.84% vs 140.39% in Mar 2026
Half Yearly Results Snapshot (Consolidated) - Sep'25
Growth in half year ended Sep 2025 is -1.07% vs 18.45% in Sep 2024
Growth in half year ended Sep 2025 is -1.39% vs 26.11% in Sep 2024
Nine Monthly Results Snapshot (Consolidated) - Dec'25
YoY Growth in nine months ended Dec 2025 is 3.86% vs 15.87% in Dec 2024
YoY Growth in nine months ended Dec 2025 is 1.37% vs 15.82% in Dec 2024
Annual Results Snapshot (Consolidated) - Mar'26
YoY Growth in year ended Mar 2026 is 3.44% vs 17.15% in Mar 2025
YoY Growth in year ended Mar 2026 is 14.83% vs 15.86% in Mar 2025
About Havells India Ltd.

Company Coordinates


