
Compare Integ. Thermopl. with Similar Stocks
Stock DNA
Plastic Products - Industrial
INR 4 Cr (Micro Cap)
1.00
36
0.00%
-0.54
-9.20%
-0.08
Total Returns (Price + Dividend) 
Integ. Thermopl. for the last several years.
Risk Adjusted Returns v/s
Returns Beta

News
When is the next results date for Integrated Thermoplastics Ltd?
The next results date for Integrated Thermoplastics Ltd is scheduled for 25 May 2026....
Read full news article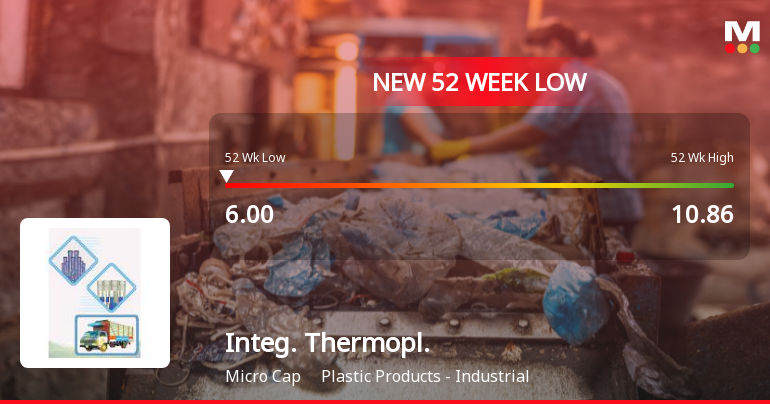
Integrated Thermoplastics Ltd Falls to 52-Week Low of Rs 6 as Sell-Off Deepens
A sharp decline has pushed Integrated Thermoplastics Ltd to a fresh 52-week low of Rs 6 on 7 May 2026, marking a significant 44.7% drop from its peak of Rs 10.86 within the last year. This fall comes amid persistent underperformance relative to the broader market and sector peers.
Read full news article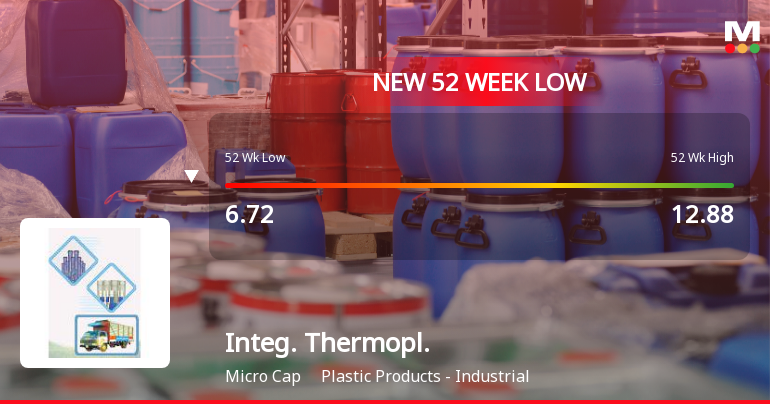
Integrated Thermoplastics Ltd Falls to 52-Week Low of Rs 6.3 as Sell-Off Deepens
A sharp decline over the past two sessions has dragged Integrated Thermoplastics Ltd to a fresh 52-week low of Rs 6.3 on 28 Apr 2026, marking a 26.5% drop over the last year and signalling intensified selling pressure despite some recent profit growth.
Read full news article Announcements
Newspaper Publication Of Financial Results As Required Under Regulation 47 Of The SEBI (Listing Obligations And Disclosure Requirements) Regulations 2015.
27-May-2026 | Source : BSENewspaper Publication of Financial Results for the Fourth Quarter and Financial Year ended 31 March 2026
Outcome Of Board Meeting Held On 25TH May 2026 Pursuant To Regulation 30 Of The Securities And Exchange Board Of India (Listing Obligations And Disclosure Requirements) Regulations 2015
25-May-2026 | Source : BSEOUTCOME OF BOARD MEETING
Board Meeting Outcome for Outcome Of Board Meeting Held On 25TH May 2026 Pursuant To Regulation 30 Of The Securities And Exchange Board Of India (Listing Obligations And Disclosure Requirements) Regulations 2015
25-May-2026 | Source : BSEOutcome of Board Meeting held on 25TH May 2026 pursuant to Regulation 30 of the Securities and Exchange Board of India (Listing Obligations and Disclosure Requirements) Regulations 2015
Corporate Actions

No Upcoming Board Meetings

No Dividend history available

No Splits history available

No Bonus history available

No Rights history available
Quality key factors
Valuation key factors
Technicals key factors
 Technical Indicator Scale: Bearish, Mildly Bearish, Sideways, Mildly Bullish, Bullish Turned
 Shareholding Snapshot : Mar 2026
Shareholding Compare (%holding)
Non Institution
None
Held by 1 Schemes (0.57%)
Held by 0 FIIs
Sujala Pipes Private Limited (21.69%)
None
55.07%
Quarterly Results Snapshot (Standalone) - Mar'26 - YoY

YoY Growth in quarter ended Mar 2026 is -68.92% vs 16.54% in Mar 2025

YoY Growth in quarter ended Mar 2026 is 3,046.43% vs 106.98% in Mar 2025
Half Yearly Results Snapshot (Standalone) - Sep'25
Not Applicable: The company has declared_date for only one period
Not Applicable: The company has declared_date for only one period
Nine Monthly Results Snapshot (Standalone) - Dec'25
Not Applicable: The company has declared_date for only one period
Not Applicable: The company has declared_date for only one period
Annual Results Snapshot (Standalone) - Mar'26
YoY Growth in year ended Mar 2026 is -62.31% vs 79.06% in Mar 2025
YoY Growth in year ended Mar 2026 is 181.85% vs 39.58% in Mar 2025
About Integrated Thermoplastics Ltd

Company Coordinates


