
Compare Reliance Home with Similar Stocks
Dashboard
Weak Long Term Fundamental Strength as the company has not declared results in the last 6 months
- Poor long term growth as Net Sales has grown by an annual rate of -83.08% and Operating profit at -207.23%
Risky - No result in last 6 months
Below par performance in long term as well as near term
Stock DNA
Housing Finance Company
INR 104 Cr (Micro Cap)
NA (Loss Making)
13
0.00%
-0.76
6.88%
-2.11
Total Returns (Price + Dividend) 
Latest dividend: 1 per share ex-dividend date: Sep-12-2018
Risk Adjusted Returns v/s
Returns Beta

News
Reliance Home Finance Ltd Locks at Lower Circuit With 1.37% Loss — Sellers Queue, No Buyers in Sight
At Rs 2.09, sellers were still queuing — but there were no buyers willing to take the other side. Reliance Home Finance Ltd locked at its lower circuit of 5% on 25 Jun 2026, with unfilled sell orders and a frozen price.
Read full news article
Reliance Home Finance Ltd is Rated Strong Sell
Reliance Home Finance Ltd is rated Strong Sell by MarketsMOJO, with this rating last updated on 23 October 2025. However, the analysis and financial metrics discussed here reflect the stock's current position as of 16 June 2026, providing investors with an up-to-date view of the company’s fundamentals, returns, and market standing.
Read full news article
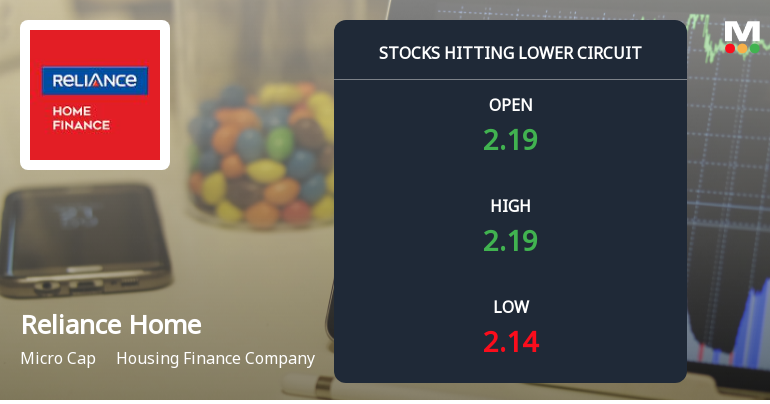
Reliance Home Finance Ltd Locks at Upper Circuit With 4.78% Gain — Buyers Queue, Sellers Absent
At Rs 2.19, the buying was done — not because demand dried up, but because the exchange wouldn't let the stock go any higher. Reliance Home Finance Ltd locked at its upper circuit of 4.78% on 8 Jun 2026, with buyers queuing and no sellers willing to part with shares.
Read full news article Announcements
Corporate Insolvency Resolution Process (CIRP)-Intimation of meeting of Committee of Creditors
18-Jun-2026 | Source : BSEpursuant to Regulation 30 of the SEBI (Listing Obligations and Disclosure Requirements) Regulations 2015 read with sub-clause 16(g) of Para A of Part A of Schedule III thereto we had informed that the 11th (Eleventh) Meeting of the Committee of Creditors (CoC) of the Company was scheduled to be held on Monday June 15 2026 at 03:00 P.M. (IST) through Video Conferencing. We wish to inform you that the aforesaid Meeting of the Committee of Creditors (CoC) has been rescheduled and will now be held as under: Date: Wednesday June 24 2026 Time: 11:00 A.M. (IST) Mode: Video Conferencing
Corporate Insolvency Resolution Process (CIRP)-Intimation of meeting of Committee of Creditors
15-Jun-2026 | Source : BSEpursuant to Regulation 30 of SEBI (Listing Obligations and Disclosure Requirements) Regulations 2015 read with sub-clause 16(g) of Para A of Part A of Schedule III we wish to inform you that the 11th Meeting of the Committee of Creditors of the Corporate Debtor will be held as under: Date: Monday June 15 2026 Time: 03:00 P.M. (IST) Mode: Video Conferencing
Corporate Insolvency Resolution Process (CIRP)-Intimation of meeting of Committee of Creditors
09-Jun-2026 | Source : BSEPursuant to Regulation 30 of the SEBI (Listing Obligations and Disclosure Requirements) Regulations 2015 (Listing Regulations) and in accordance with sub-clause 16(g) of Para A of Part A of Schedule III of the Listing Regulations We hereby inform you that the 10th Meeting of the Committee of Creditors (CoC) of Reliance Home Finance Limited (In CIRP) scheduled to be held on Tuesday June 09 2026 at 03:00 P.M. (IST) through Video Conferencing and was duly held on Tuesday June 09 2026 at 03:00 P.M. (IST) through Video Conferencing.
Corporate Actions

No Upcoming Board Meetings

Reliance Home Finance Ltd has declared 10% dividend, ex-date: 12 Sep 18

No Splits history available

No Bonus history available

No Rights history available
Quality key factors
Valuation key factors
Technicals key factors
 Technical Indicator Scale: Bearish, Mildly Bearish, Sideways, Mildly Bullish, Bullish Turned
 Shareholding Snapshot : Mar 2025
Shareholding Compare (%holding)
Non Institution
None
Held by 142 Schemes (0.0%)
Held by 622 FIIs (0.01%)
Reliance Infrastructure Consulting & Engineers Private Limited (0.61%)
Ramakrishna Reddy Chinta (2.43%)
88.97%
Quarterly Results Snapshot (Standalone) - Mar'25 - YoY

YoY Growth in quarter ended Mar 2025 is -100.00% vs -99.76% in Mar 2024

YoY Growth in quarter ended Mar 2025 is 89.78% vs -100.11% in Mar 2024
Half Yearly Results Snapshot (Standalone) - Sep'24
Growth in half year ended Sep 2024 is -28.57% vs -99.83% in Sep 2023
Growth in half year ended Sep 2024 is 364.93% vs 101.89% in Sep 2023
Nine Monthly Results Snapshot (Standalone) - Dec'24
YoY Growth in nine months ended Dec 2024 is -50.00% vs -99.86% in Dec 2023
YoY Growth in nine months ended Dec 2024 is 676.88% vs 100.58% in Dec 2023
Annual Results Snapshot (Standalone) - Mar'25
YoY Growth in year ended Mar 2025 is -64.52% vs -99.84% in Mar 2024
YoY Growth in year ended Mar 2025 is 780.85% vs -100.07% in Mar 2024
About Reliance Home Finance Ltd

Company Coordinates


