
Compare VRL Logistics with Similar Stocks
Dashboard
Healthy long term growth as Operating profit has grown by an annual rate 34.72%
The company has declared Positive results for the last 7 consecutive quarters
With ROCE of 17.1, it has a Very Attractive valuation with a 2.3 Enterprise value to Capital Employed
High Institutional Holdings at 28.03%
Consistent Underperformance against the benchmark over the last 3 years
Stock DNA
Transport Services
INR 4,221 Cr (Small Cap)
18.00
36
4.16%
1.00
20.73%
3.68
Total Returns (Price + Dividend) 
Latest dividend: 5.00687994496044 per share ex-dividend date: Feb-13-2026
Risk Adjusted Returns v/s
Returns Beta

News
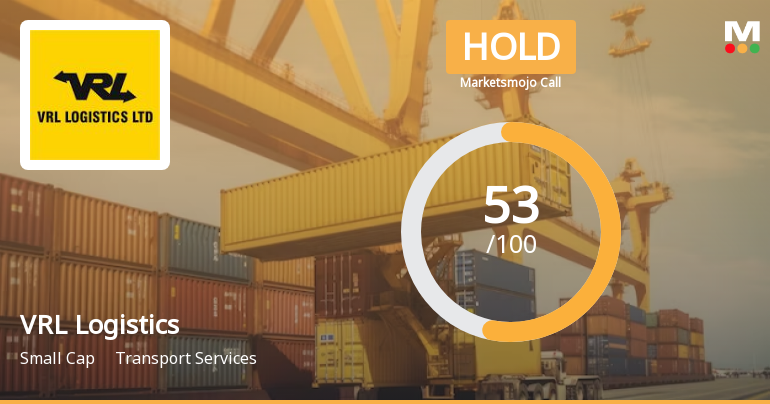
VRL Logistics Ltd is Rated Hold by MarketsMOJO
VRL Logistics Ltd is rated 'Hold' by MarketsMOJO, with this rating last updated on 19 May 2026. However, all fundamentals, returns, and financial metrics discussed here reflect the stock's current position as of 18 June 2026, providing investors with an up-to-date analysis of the company’s performance and outlook.
Read full news article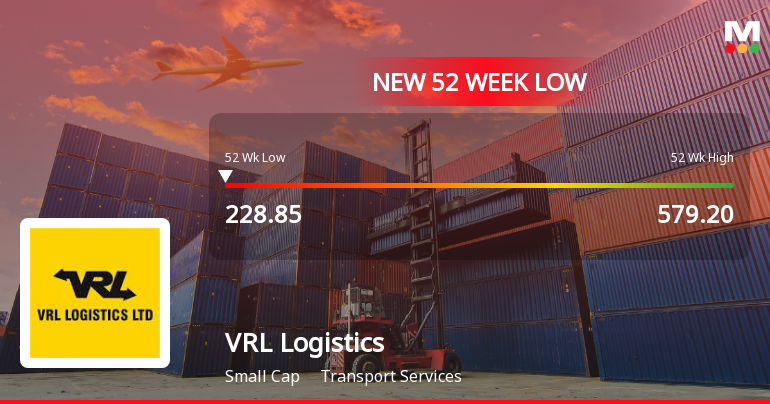
VRL Logistics Ltd Falls to 52-Week Low of Rs 228.85 as Sell-Off Deepens
For the second consecutive session, VRL Logistics Ltd has seen its share price decline, hitting a fresh 52-week low of Rs 228.85 on 11 Jun 2026. This drop comes despite the broader logistics sector gaining 2.24% and the Sensex recovering from an early dip to close marginally higher.
Read full news article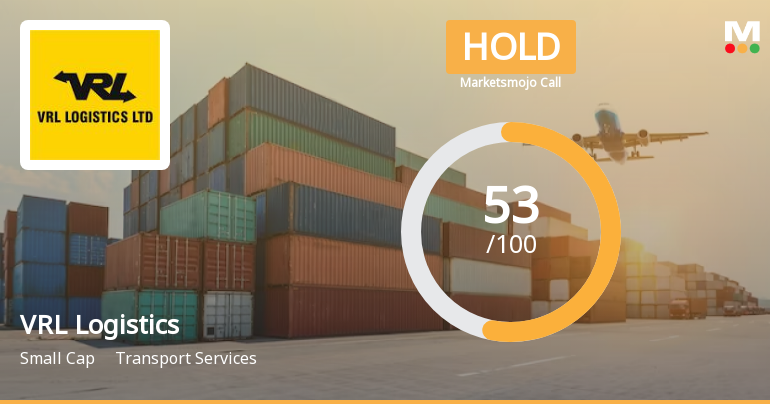
VRL Logistics Ltd is Rated Hold by MarketsMOJO
VRL Logistics Ltd is rated 'Hold' by MarketsMOJO, with this rating last updated on 19 May 2026. While the rating change occurred on that date, the analysis and financial metrics presented here reflect the stock’s current position as of 08 June 2026, providing investors with an up-to-date view of the company’s fundamentals, returns, and market standing.
Read full news article Announcements
Announcement under Regulation 30 (LODR)-Earnings Call Transcript
22-May-2026 | Source : BSEIn terms of Regulation 30 of the SEBI (Listing Obligations and Disclosure Requirements) Regulations 2015 we herewith attach transcript of the Earning Call held on 19th May 2026.
Announcement under Regulation 30 (LODR)-Analyst / Investor Meet - Outcome
19-May-2026 | Source : BSEWe refer to our communication dated 12th May 2026 Informing about schedule of earnings call to be held today i.e. 19th May 2026 relating to the financial results for the quarter and year ended 31st March 2026. In terms of Regulation 30 of the SEBI (Listing Obligation and Disclosure Requirement) Regulations 2015 we hereby inform you that the audio recording of the earnings call is available at the below link:
Announcement under Regulation 30 (LODR)-Investor Presentation
18-May-2026 | Source : BSEWith respect to above captioned subject and in accordance with the extant provisions of the SEBI(LODR) Regulations 2015 and other applicable provisions for the time being in force we enclose herewith the Earning Presentations of the Company.
Corporate Actions

No Upcoming Board Meetings

VRL Logistics Ltd has declared 50% dividend, ex-date: 13 Feb 26

No Splits history available

VRL Logistics Ltd has announced 1:1 bonus issue, ex-date: 14 Aug 25

No Rights history available
Quality key factors
Valuation key factors
Technicals key factors
 Technical Indicator Scale: Bearish, Mildly Bearish, Sideways, Mildly Bullish, Bullish Turned
 Shareholding Snapshot : Mar 2026
Shareholding Compare (%holding)
Promoters
None
Held by 10 Schemes (24.34%)
Held by 76 FIIs (2.98%)
Anand Vijay Sankeshwar (31.43%)
Hdfc Mutual Fund - Hdfc Dividend Yield Fund (9.77%)
10.0%
Quarterly Results Snapshot (Standalone) - Mar'26 - QoQ

QoQ Growth in quarter ended Mar 2026 is 3.13% vs 3.76% in Dec 2025
QoQ Growth in quarter ended Mar 2026 is 11.43% vs 29.77% in Dec 2025
Half Yearly Results Snapshot (Standalone) - Sep'25
Growth in half year ended Sep 2025 is 0.96% vs 10.35% in Sep 2024

Growth in half year ended Sep 2025 is 102.86% vs -8.20% in Sep 2024
Nine Monthly Results Snapshot (Standalone) - Dec'25
YoY Growth in nine months ended Dec 2025 is 0.70% vs 10.93% in Dec 2024
YoY Growth in nine months ended Dec 2025 is 51.52% vs 61.46% in Dec 2024
Annual Results Snapshot (Standalone) - Mar'26
YoY Growth in year ended Mar 2026 is 1.90% vs 9.43% in Mar 2025
YoY Growth in year ended Mar 2026 is 29.47% vs 105.88% in Mar 2025
About VRL Logistics Ltd

Company Coordinates


