
Compare Can Fin Homes with Similar Stocks
Dashboard
Strong Long Term Fundamental Strength with an average Return on Equity (ROE) of 17.03%
The company has declared Positive results for the last 3 consecutive quarters
With ROE of 19.9, it has a Fair valuation with a 2.1 Price to Book Value
High Institutional Holdings at 37.98%
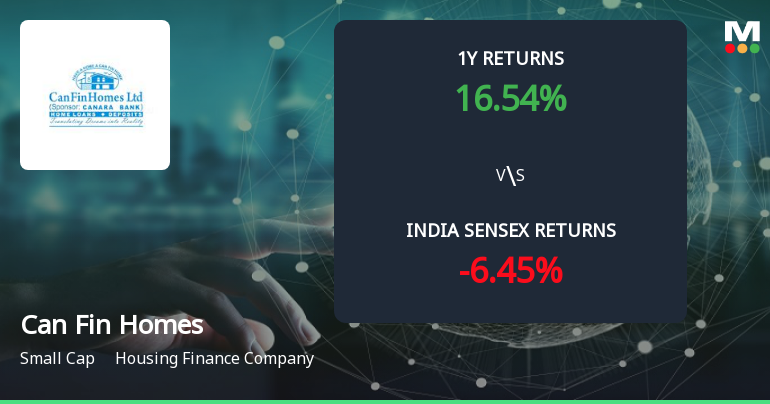
Market Beating Performance
Stock DNA
Housing Finance Company
INR 11,794 Cr (Small Cap)
11.00
13
1.46%
6.61
19.88%
2.16
Total Returns (Price + Dividend) 
Latest dividend: 7 per share ex-dividend date: Dec-19-2025
Risk Adjusted Returns v/s
Returns Beta

News
Golden Cross Confirmed: Do Can Fin Homes Ltd.'s Other Technical Indicators Agree?
The 50-day moving average for Can Fin Homes Ltd. has crossed above the 200-day moving average, signalling a golden cross on 22 Jun 2026. While this technical event often suggests a shift towards bullish momentum, the broader technical and fundamental context must be examined to assess the signal's reliability.
Read full news article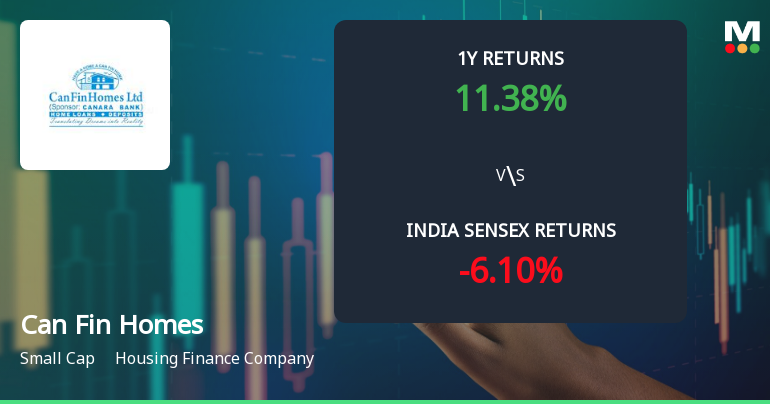
Can Fin Homes Ltd. Technical Momentum Shifts Amid Mixed Indicator Signals
Can Fin Homes Ltd., a small-cap player in the housing finance sector, has recently exhibited a subtle shift in its technical momentum, moving from a sideways trend to a mildly bullish stance. Despite mixed signals from key technical indicators such as MACD, RSI, and moving averages, the stock’s price action and volume patterns suggest cautious optimism among investors as it navigates current market conditions.
Read full news article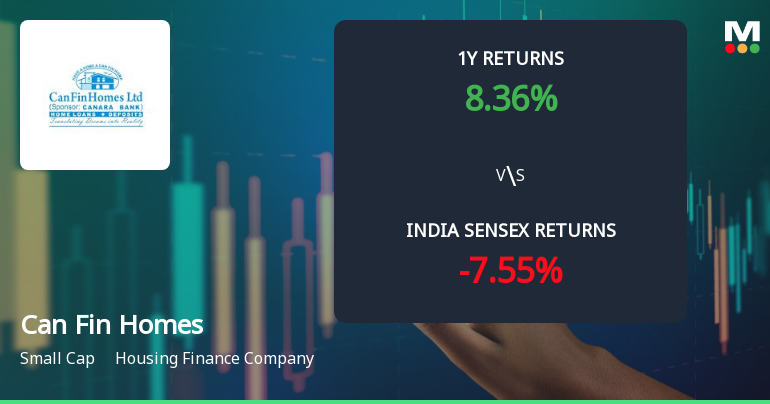
Can Fin Homes Ltd. Technical Momentum Shifts Amid Mixed Signals
Can Fin Homes Ltd., a small-cap player in the housing finance sector, has experienced a notable shift in its technical momentum, moving from a mildly bearish stance to a sideways trend. Despite a recent upgrade in its technical trend, the stock presents a complex picture with mixed signals from key indicators such as MACD, RSI, Bollinger Bands, and moving averages, reflecting a cautious outlook for investors.
Read full news article Announcements
Intimation Under Regulation 30 Of SEBI (Listing Obligations And Disclosure Requirements) Regulations 2015 (SEBI Listing Regulations)
20-Jun-2026 | Source : BSEIntimation under Regulation 30 of SEBI Listing Regulations 2015
Announcement under Regulation 30 (LODR)-Newspaper Publication
19-Jun-2026 | Source : BSEPlease find enclosed copies of Newspaper Publication regarding 39th AGM Record Date Final Dividend
Intimation To Shareholders Regarding TDS On Final Dividend For FY 2025-26
19-Jun-2026 | Source : BSEPlease find enclosed the copy of the letter sent to shareholders of the Company on 18/06/2026 regarding information to be submitted by shareholders w.r.t. TDS on Final Dividend for FY 2025-26.
Corporate Actions

No Upcoming Board Meetings

Can Fin Homes Ltd. has declared 400% dividend, ex-date: 03 Jul 26

Can Fin Homes Ltd. has announced 2:10 stock split, ex-date: 12 Oct 17

No Bonus history available

Can Fin Homes Ltd. has announced 3:10 rights issue, ex-date: 23 Jan 15
Quality key factors
Valuation key factors
Technicals key factors
 Technical Indicator Scale: Bearish, Mildly Bearish, Sideways, Mildly Bullish, Bullish Turned
 Shareholding Snapshot : Mar 2026
Shareholding Compare (%holding)
Non Institution
None
Held by 27 Schemes (16.28%)
Held by 170 FIIs (13.37%)
Canara Bank-mumbai (29.99%)
Chhatisgarh Investments Limited (6.27%)
18.37%
Quarterly Results Snapshot (Standalone) - Mar'26 - YoY

YoY Growth in quarter ended Mar 2026 is 7.52% vs 7.74% in Mar 2025

YoY Growth in quarter ended Mar 2026 is 47.77% vs 11.91% in Mar 2025
Half Yearly Results Snapshot (Standalone) - Sep'25
Growth in half year ended Sep 2025 is 9.31% vs 11.72% in Sep 2024
Growth in half year ended Sep 2025 is 15.61% vs 20.38% in Sep 2024
Nine Monthly Results Snapshot (Standalone) - Dec'25
YoY Growth in nine months ended Dec 2025 is 9.13% vs 10.92% in Dec 2024
YoY Growth in nine months ended Dec 2025 is 18.75% vs 15.06% in Dec 2024
Annual Results Snapshot (Standalone) - Mar'26
YoY Growth in year ended Mar 2026 is 8.70% vs 10.09% in Mar 2025
YoY Growth in year ended Mar 2026 is 26.67% vs 14.18% in Mar 2025
About Can Fin Homes Ltd.

Company Coordinates


